Unit - 4
Project Monitoring and Control
Q1) What is Resource smoothing?
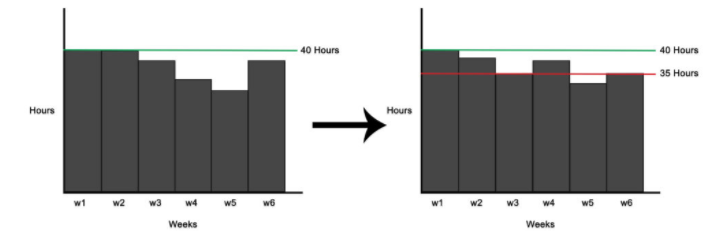
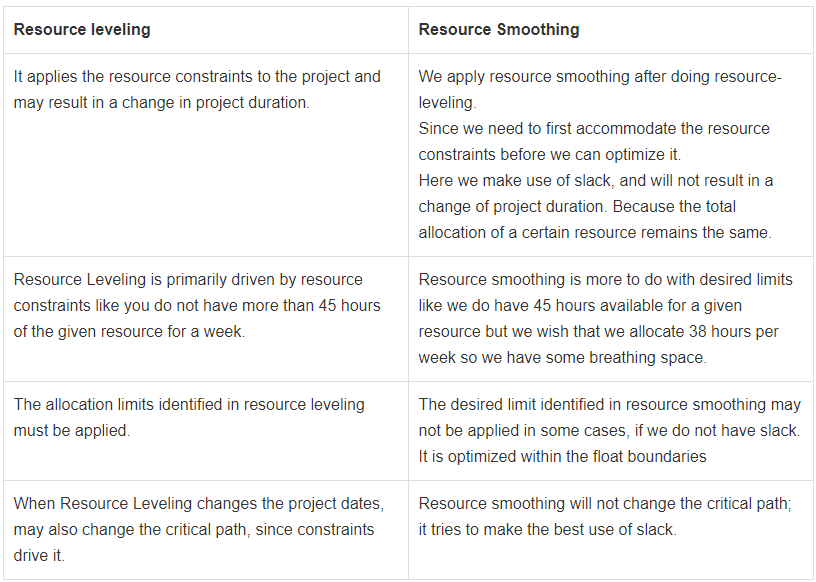
A1) Resource smoothing is used to optimize the resources and when you cannot extend the schedule.

Since the schedule cannot be extended the project completion date and the critical path will stay the same. Hence the activities cannot be delayed more than their total and free float.
In resource smoothing, make sure to avoid any delay in activity as it may affect your critical path. Time is the main constraint here. You have a fixed schedule and are asked to optimize resources.
Resource smoothing is also known as time constrained scheduling (TCS). The project end date cannot be changed, and you have to optimize resources within the float.
Q2) What are the difference between resource leveling and resource smoothing
A2)

Q3) What is network crashing? What are the steps taken by project manager to crash the project?
A3) Network Crashing
The crashing of a project is the act of shortening the duration of a project by cost efficiently allocating more resources to activities on the critical path.
To crash the project the project manager can follow the steps.
Create an Activity on Node network.
The Activity on Node network is critical in order for the project manager to get an overview of the project.
Define the critical path
From the AON network the critical path should be found. This is important as it singles out the activities that crash.
Note: That when crashing activities on the critical path, this will eventually lead to another path being the critical path and might even result in multiple critical paths.
Calculate the cost/time slope for each activity that can be crashed. This step defines the activities that yields most value for money, meaning period for period they cost the least to crash.
Determine crashing sequence
The PM can determine the crashing sequence by crashing activities from cheapest to most expensive. This will result in a time-cost curve. From the curve the duration of the project will decrease with increasing cost.
The more time is saved, the steeper the curve gets, as the crashing per activity cost increases until it doesn't make sense to crash the project anymore.
One aspect to keep in mind when determining the crashing sequence is that of partial crashing. Is not possible it has to be crashed for 4 period intervals of time for example.
Update the critical path
Crashing of the existing critical path will lead to another path eventually becoming the critical path or even lead to multiple critical paths. The PM has to check which path is the critical after each individual crash.
Crashing of a project is not always the best option and might even lead to increased risks.
Q4) What is Project monitoring?
A4) Project Monitoring
Q5) What are the methods of Project monitoring?
A5) The methods are:
Time sheets
Once project development commences, the management has to track the progress of the project and the expenditure incurred on the project. The Progress can be monitored with the schedule and milestones laid down in the plan.
Reviews
Reviews provide information for project control, also a definite and clearly defined milestone. It forces the author of product to complete the product before the review. Having this goal gives some impetus and motivation to complete the product.
Cost-Schedule-Milestone Graph
The cost-schedule milestone graph represents the planned cost of different milestones. It displays the actual cost of achieving the milestones obtained. By having both the planned cost versus milestones and the actual cost versus milestones on the same graph, the progress of the project can be analyzed.
Updating and Earned Value Analysis
Earned Value Analysis:
Earned Value Analysis (EVA) is a tool for controlling your project progress.
Regardless of the size and complexity of the projects earned value analysis provides:
While evaluating the current status of a project the some of the questions that arise are:
Simple Cost Variance
To determine the difference between planned and actual effort till date a baseline as a reference is required. This baseline needs to be set after the planning has been completed but before the first change and update with actual data.
Earned Value
Earned value (EV) now establishes a relation between the stage of physical completion by the status date and the corresponding planned effort. This displays the status date what effort was planned and the actual work performed.

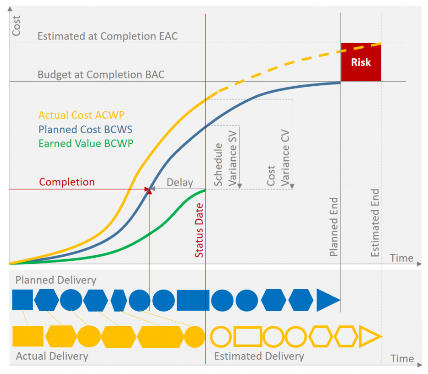
The illustration below shows the progression of planned costs and actual costs up to the status date and the stage of physical job completion from which the earned value is deduced. The blue curve shows the progression of costs in relation to the planned work (BCWS – Budgeted Cost of Work Scheduled) rising up to the level of the planned overall costs (BAC – Budget at Completion).
After the delivery items up to the current date (Actual Delivery) have been determined the result is transferred back to original planning (Planned Delivery).
This is where the real stage of physical job completion can be identified, which is significantly lagging behind expectations.
Thus, it is possible to read from the plan curve what value the actual delivery has according to the plan. This is the earned value or also BCWP – Budgeted Cost of Work Performed.
Earned value therefore represents the costs which according to the original planning would have been necessary to reach the stage of physical completion attained on the status date.
Real Cost Variance (CV)
CV = BCWP – ACWP reveals the difference between actual costs and earned value.
Mainly used to describe the efficiency of projects.
CV% = [BCWP-ACWP]/BCWP)
In terms of cost index performance
CPI = BCWP/ACWP
Real Schedule Variance (SV)
SV = BCWP – BCWS shows the difference between planned costs and earned value.
It clarifies the financial gap between results obtained and results planned.
In terms of percentage
SV% = BCWP-BCWS]/BCWP
It is also a figure that can be compared across projects. The schedule variance will impact time at all events.
It can also be calculated using the Schedule Performance Index SPI = BCWP/BCWS
It equals 1 if everything is OK.
Below 1 indicates that the costs for the results obtained are lagging behind schedule
Above 1 indicates that the work performed is ahead of schedule.
An SPI of 0.8 reveals a delay whereas an SPI of 1.2 indicates a speed-up.
Q6) What is project management software?
A6) It is a process of managing, allocating, and timing resources in order to develop computer software that meets requirements. In software project management, end users and developers need to know the length, duration and cost of the project. It is a sub-discipline of project management in which software projects are planned, implemented, monitored and controlled. It consists of eight tasks: Problem identification, Problem definition, Project planning, Project organization, Resource allocation, Project planning, Follow-up, reporting and control, Project completion. In problem identification and definition, decisions are made while projects are approved, rejected or prioritized. When the problem is identified, the project is identified, defined and justified. Purpose of the project is clarified. The main product is the project proposal. The project plan describes a series of actions or steps that are required in the development of the work product. The functions of the staff are integrated in the project organization. This takes place parallel to the project planning.
Q7) What are the features of Project Management software?
A7) Features:
To ensure that the schedule is filled appropriately, Primavera P6 includes an array of scheduling alerts and reporting tools, resulting in keeping the project on schedule and within budget.
2. Risk and Opportunity Management:
Project Managers can easily identify when risks occur, and the impact of these risks in the project’s baseline and schedule. Initial and recurring risk is conducted by project managers and also opportunity analysis is done within the schedule.
3. Resource Management:
Uses of these resources has to be monitored closely by Project Managers within Primavera P6, and generate forecasts of changes in resource availability.
To keep the project on track, project managers identify what other resources may be diverted within Primavera P6. ERPM users can transform raw data into easily understandable and shareable graphics by taking advantage of the visualization tool.
4. Contract Management:
Organization can keep control over multiple projects or programs with the help of Primavera. Project Managers can copy information from the Oracle database in seconds when a new project closely mirrors a previous project.
Q8) What are the advantages of Project Monitoring?
A8) Advantages
Project expenses grow when your schedule has inconsistencies, overrun issues or errors, and to compensate for the excess costs you have to remove more important parts of the project. Primavera in the course of managing, completing and planning a project helps in identifying and mitigating risks.
b. User-Friendly:
Accessing and managing the project schedule remains simple, in spite of many complex analyses and processes that Primavera offers. The software simply determines if any problem exists, once you input the information.
c. Expanded Resources:
All the available resources involved in a project is carefully monitored by Primavera, adjusting such resources to meet the demands of the project. It also helps in reducing resource cost by analyzing resource trends and costs.
d. Improved Visibility:
The topmost priority of Project Managers and business executives are the visibility and compliance with environmental and political regulations. You can ensure possible violations of your project beforehand as the Primavera allows entry, tracking, and analysis of all the data in one location.
e. Predicting of Project Activities:
Forecasts for resources, activities and other project needs can be made with the help of Primavera Software, as a project may require activities, resources, and tasks to meet stakeholder demands, as the project evolves.
f. Tracking Features:
By ensuring all the project to be completed, maintaining baseline adherence, the tracking feature of Primavera allows rapid generation of reports by the users.
g. Improved Communication:
Primavera helps in enhanced communication, between executive-level staffs and other workers, project managers, and planners demand large geographic areas, hundreds of workers and other stakeholders. To ensure all the users view the message, notes can be entered to the schedule in the software.
h. Enhanced Collaboration:
When Projects acquires large span, better communication translates into better collaboration easily, since communication is already enhanced throughout a project.
i. The Responsibility is given to Employees in Schedule Creation:
By allowing the user access to the schedule, Primavera makes planning and scheduling method easier. Also, workers from their location can create their schedules in the software. Also, they can turn in timesheets, perform other scheduling functions and make schedule requests.
j. Disintegrate Complex Projects:
Primavera helps project managers in breaking large projects into smaller, easier projects, activities, and tasks as the project size can be large and overwhelming.
Q9) What are the objectives of case study in housing finance
A9) Their primary objectives are the following: ·
In their current business, the retailer is involved in selling thousands of home improvement products. Starting from a simple carpet installation to a whole house redesign including kitchen, bath, and flooring remodeling, the retailer historically is in the business of selling products. They have existing relationships with contractors that provide measure, deliver, and installation services. But all collaboration is through phone or fax. There are dedicated employees that handle the collaboration in the case of complex projects acting as project superintendents.