Unit - 5
Project Economics
Q1) What are the four basic principles that lay emphasis in construction projects
A) There are four basic principles that lay emphasis in construction projects economics
The four basic principles that underpin construction projects are
Supply is defined as the total number of goods or service available for purchase. The two key determinants of price are demand and supply. Therefore, viewing the demand, supply is calculated. Other factors affect supply are the price of other related goods.
Example: Paper is made from trees; therefore, a tree would be considered a related good to paper. If the price of harvesting a tree increases, the supply for paper will decrease.

Example if the supply of housing has decreased there would be no point in purchasing a house for refurbishment and selling it on as the demand would decrease. Therefore, when beginning a project, the related supply must be checked and then the project should be started at the estimated time of equilibrium.
b. Demand
Demand is widely used in economics in simple it means that if you desire to own good or service then you should have the ability and willingness to pay. There are several factors that affect demand the main is supply. The other factors that affect demand are
Market
Depending on the type of market there is a construction project can be affected in many ways.
Example: Command economy may be just building houses when needed, they will sell house if they need to be sold, and there is little room for choice.
A free market will build entirely out of will; if it is needed then it will be built. If someone has the desire and the correct funds to build a house, then they will. And if someone wishes to purchase a house, they will agree an amount and pay it off.
Mixed economy is the best of both, however in many circumstances the price for housing price does rise and fall. But anyone person can build at their own will, but they will need planning permission.
Types of Business
Every business structure aim to successful though they serve different purpose. The types of businesses are
Individual owns and runs business on his own without the need of employees. Example: Corner Shop
b. Partnerships:
Two or more people working together to make profit. The partners together own the business and normally share out profits equally between each other. Example: Small/medium sized grocery store.
c. Public limited companies:
It is a limited liability company whose shares may be freely sold and traded to the public. It has a separate legal identity.
Example: NatWest bank
d. Private limited companies:
A private limited company, is a type of privately held small business entity. This type of business entity limits owner liability to their shares, limits the number of shareholders to 50, and restricts shareholders from publicly trading shares.
e. Housing Associations:
A housing association is an organization which owns houses and helps its members to rent or buy them more cheaply than on the open market.
f. Non-Profit Organizations:
Non-profit making organizations tend to help the local area or community and all surpluses are not distrusted but it is put back into the company to help it grow and achieve its goal.
Q2) What are the difference between Cost, Value, Price?
A2)
Comparison | Value | Cost | Price |
Meaning | Utility of good or service | Amount incurred in producing and manufacturing product | Amount paid for acquiring a product or service |
Estimation | Through Opinion | Through fact | Through policy |
Ascertainment | From User’s Perspective | Producer’s Perspective | Customer’s perspective |
Money | Rarely calculated in terms of money | Calculated in terms of money | Calculated in terms of money |
Impact of Variations in Market | Value remains unchanged | Cost of inputs rise or fall | Price of product increase or decrease. |
Q3) What are the kinds of annuities? Explain.
A3)
Capital Recovery Annuity:
This is applied in the case of debt payments where the initial debt or capital is recovered in uniform or equal periodic payments.
CRF = (i (1 + i)) n / (1 + i) n -1; i- compound interest rate; n = no of interest period
Present Worth Annuity:
Applied to premium and all other retirements plan hence known as Premium Annuities.
PW = D [(1 + i) n – 1/i(1+i) n]
D = Periodical payment amount
i= Compound interest rate
n= no of interest period.
Sinking Fund
This is applied to define sum required to be called at future date by setting aside equal interval of time so that the equal period payment while earning compound interest total up desired amount at the desired future date.
Sinking fund factor = i/ (1 + i) n -1
i= compound interest rate
n = no of interest period
Compound
The person deposits at the end of number of periods and each amount is allowed to earn compound interest per period. This is used in saving deposit scheme.
Compound Amount annuity = (1 + i) n – 1/ i
i= Compound interest rate
n = no of interest period
Q4) What are the two types of demand schedule?
A4)
There are two types of Demand Schedules:
Individual Demand Schedule
It depicts the demand of an individual customer for a commodity in relation to its price.
For example
Price per unit of commodity X (Px) | Quantity demanded of commodity X (Dx) |
100 | 50 |
200 | 40 |
300 | 30 |
400 | 20 |
500 | 10 |
The above schedule depicts the individual demand schedule. We observe that when the price is ₹100, its demand is 50 units and when its price is ₹500, its demand decreases to 10 units.
Market Demand Schedule
The summation of the individual demand schedules and depicts the demand of different customers for a commodity in relation to its price.
Example.
Price per unit of commodity X (Px) | Quantity demanded by Consumer A(Qa) | Quantity demanded by Consumer B(Qb) | Market Demand (Qa + Qb) |
100 | 50 | 70 | 120 |
200 | 40 | 60 | 100 |
300 | 30 | 50 | 80 |
400 | 20 | 40 | 60 |
500 | 10 | 30 | 40 |
Q5) What is law of demand?
A5) The law of demand describes the relationship between the quantity demanded and the price of a product.
It states that the demand for a product decreases with increase in its price and vice versa, while other factors are at constant.
Therefore, there is an inverse relationship between the price and quantity demanded of a product.
“The amount demanded increases with a fall in price and diminishes with a rise in price”-Marshall.
Price is an independent variable while demand is a dependent variable.
D = f(P)
Demand is the function price where
D= demand
P=price
F= functional relationship
In the law of demand, other factors expect price should be kept constant where is demand is subject to various influences.
Q6) Explain demand curve?
A6)
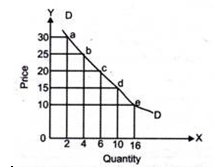
The curve which shows the relationship between the price of a commodity and the amount of that commodity the consumer wishes to purchase is called Demand Curve.”
Demand curve can be of two types
Price of A (per kg) | Quantity Demanded (per week in kgs) |
10 | 15 |
15 | 10 |
20 | 8 |
25 | 4 |
30 | 2 |

Market Demand Curve
Q = f(P) = q1 + q2 + ……... + qn.
Price | Jack | Jill | Market |
$2.00 | 17 | 28 | 45 |
$2.50 | 16 | 26 | 42 |
$3.0 | 15 | 24 | 39 |
$3.50 | 14 | 22 | 36 |
$4.00 | 13 | 20 | 33 |
$4.50 | 12 | 18 | 30 |
$5.0 | 11 | 16 | 27 |
$5.50 | 10 | 14 | 24 |
$6.0 | 9 | 12 | 21 |
Q7) What are the types of elasticity of demand?
A7)
Based on the variable that affects the demand, the elasticity of demand is of the following types.
Price Elasticity
The price elasticity of demand is the response of the quantity demanded to change in the price of a commodity. It is measured as a percentage change in the quantity demanded divided by the percentage change in price. Therefore,
Ep = Change in quantity x Original Price
Original quantity Change in Price
Cross Elasticity
The cross elasticity of demand of a commodity X for another commodity Y, is the change in demand of commodity X due to a change in the price of commodity Y.
Ec = cross-elasticity
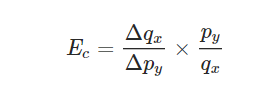 = change in original price of commodity y.
Q8) What is supply schedule?
A8) Supply schedule is defined as a relation between the price of goods or services versus and the number of goods supplied. The price elasticity of demand is the response of the quantity demanded to change in the price of a commodity
Elasticity of demand is the responsiveness of the quantity demanded of a commodity to changes in one of the variables on which demand depends
The cross elasticity of demand of a commodity X for another commodity Y, is the change in demand of commodity X due to a change in the price of commodity Y.
The Law of Supply states that when the price of a commodity falls, its supply also decreases and when the price of a commodity rises, its supply also increases with other things remaining constant.
Supply schedule is defined as a relation between the price of goods or services
Individual Supply Schedule
A supply schedule depicts the supply by an individual firm or producer of a commodity in relation to its price
Price per unit commodity X | Quantity supplied of commodity X |
100 | 1000 |
200 | 2000 |
300 | 3000 |
400 | 4000 |
500 | 5000 |
The above schedule depicts the individual supply schedule. We can see that when the price of the commodity is ₹100, its supply is 1000 units. Similarly, when its price is ₹500, its supply increases to 5000 units.
Market Supply Schedule
It is a summation of the individual supply schedules and depicts the supply of different customers for a commodity in relation to its price.
Example.
Price per unit of commodity X | Quantity supplied by firm A | Quantity supplied by firm B | Market Supply Qa + Qb |
100 | 1000 | 3000 | 4000 |
200 | 2000 | 4000 | 6000 |
300 | 3000 | 5000 | 8000 |
400 | 4000 | 6000 | 10000 |
500 | 5000 | 7000 | 12000 |
Thus, we can conclude that whether it is the individual supply or the market supply, the law of supply governs both of them.
Q9) Explain supply curve.
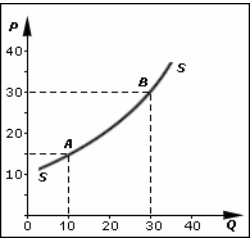
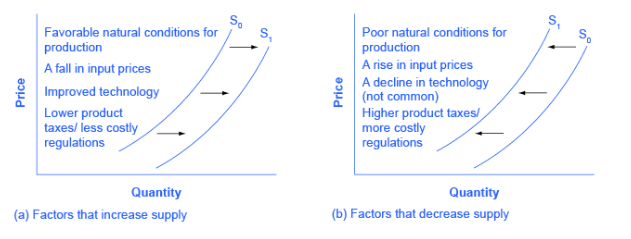
A9) The supply curve is the locus of all the points showing various quantities of a commodity that a producer is willing to sell at various levels of prices, during a given period of time, assuming no change in other factors. The supply curve is a good measure of comparison. One can simply look at the supply curves of two firms and distinguish between them. When the price of a commodity changes, the quantity supplied of a commodity changes suitably keeping others constant. This is because of the direct relationship between the two. A change in price either causes supply curves to expand or contract. If the prices increase, other factors kept constant, there is an increase in the quantity supplied which is referred to as an expansion in supply. Graphically, this is represented as an upward movement along the same supply curve. Conversely, if the prices decrease, keeping other factors constant, firms tend to decrease the supply. This is referred to as a contraction in supply. Graphically, this is represented as a downward movement along the same supply curve.

A rightward shift indicates a positive effect on the curve whereas a leftward shift indicates a negative effect on the supply curve.
Q10) What are the factors affecting Price Determination?
A10) Factors affecting Price Determination
Main factors affecting price determination of product are:
1. Product cost
It refers to the total of fixed costs, variable costs and semi variable costs incurred during the production, distribution and selling of the product. Fixed costs are those costs which remain fixed at all the levels of production or sales. For example, rent of building, salary, etc. Variable costs refer to the costs which are directly related to the levels of production or sales. For example, costs of raw material, labour costs etc. Semi variable costs are those which change with the level of activity but not in direct proportion. For example, fixed salary of Rs 12,000 + up to 6% graded commission on increase in volume of sales. The price for a commodity is determined on the basis of the total cost. So sometimes, while entering a new market or launching a new product, business firm has to keep its price below the cost level but in the long rim, it is necessary for a firm to cover more than its total cost if it wants to survive amidst cut-throat competition.
2.The Utility and Demand:
Usually, consumers demand more units of a product when its price is low and vice versa.
However, when the demand for a product is elastic, little variation in the price may result in large changes in quantity demanded.
In case of inelastic demand, a change in the prices does not affect the demand significantly.
Thus, a firm can charge higher profits in case of inelastic demand. Moreover, the buyer is ready to pay up to that point where he perceives utility from product to be at least equal to price paid. Thus, both utility and demand for a product affect its price.
3. Extent of Competition in the Market:
The next important factor affecting the price for a product is the nature and degree of competition in the market.
A firm can fix any price for its product if the degree of competition is low.
However, when the level of competition is very high, the price of a product is determined on the basis of price of competitors’ products, their features and quality etc.
For example, MRF Tyre company cannot fix the prices of its Tyres without considering the prices of Bridgestone Tyre Company, Goodyear Tyre company etc.
4. Government and Legal Regulations:
The firms which have monopoly in the market, usually charge high price for their products. In order to protect the interest of the public, the government intervenes and regulates the prices of the commodities for this purpose; it declares some products as essential products for example. Life saving drugs etc.
5. Pricing Objectives:
(a) Profit Maximisation:
Usually, the objective of any business is to maximise the profit. During short run, a firm can earn maximum profit by charging high price. However, during long run, a firm reduces price per unit to capture bigger share of the market and hence earn high profits through increased sales.
(b) Obtaining Market Share Leadership:
If the firm’s objective is to obtain a big market share, it keeps the price per unit low so that there is an increase in sales.
(c) Surviving in a Competitive Market:
If a firm is not able to face the competition and is finding difficulties in surviving, it may resort to free offer, discount or may try to liquidate its stock even at BOP (Best Obtainable Price).
(d) Attaining Product Quality Leadership:
Generally, firm charges higher prices to cover high quality and high cost if it’s backed by above objective.
6. Marketing Methods Used:
The various marketing methods such as distribution system, quality of salesmen, advertising, type of packaging, customer services, etc. also affect the price of a product. For example, a firm will charge high profit if it is using expensive material for packing its product.
Q11) Explain law of diminishing marginal utility with example.
A11) This is an important law under Marginal Utility Analysis. Alfred Marshall, British Economist defines the law of diminishing marginal utility as follows:
“The additional benefit which a person derives from a given increase in the stock of a thing diminishes with every increase in the stock that he already has.”
This law is based on the fundamental tendency of human nature. Human wants are virtually unlimited. However, every single want is satiable. Hence, as we consume more and more units of a good, the intensity of our want for the good decreases. Eventually, it reaches a point where we no longer want it.
An Illustration
Example. The table below presents the total and marginal utility derived by Peter from consuming cups of tea per day.
Quantity of teas | Total Utility | Marginal Utility |
1 | 30 | 30 |
2 | 50 | 20 |
3 | 65 | 15 |
4 | 75 | 10 |
5 | 83 | 8 |
6 | 89 | 6 |
7 | 93 | 4 |
8 | 96 | 3 |
9 | 98 | 2 |
10 | 99 | 0 |
11 | 95 | -4 |
As seen in the table above, when Peter consumes one cup of tea in a day, he derives a total utility of 30 utils (unit of utility) and a marginal utility of 30 utils. When he takes two cups per day, the total utility rises to 50 utils but the marginal utility falls to 20. This trend continues until the last row where the marginal utility is negative. This means that if Peter consumes 11 or more cups of tea per day, then he might fall sick
Q12) What are the limitations of the law of diminishing marginal utility?
A12) Limitations of the Law
The law of diminishing marginal utility applies only under certain assumptions:
Q13) What is law of substitution?
A13) Law of substitution was propounded by famous economist HH Gossen. Therefore, it is called as Gossen’s second law. But it was fully developed by Alfred Marshall.
According to Marshall “If a person has a thing which he can put to several uses, he will distribute it among these uses in such a way that it has the same marginal utility in all”
Q14) Explain measurement of cost of capital.
A14) Measurement of Cost of Capital:
Cost of capital is measured for different sources of capital structure of a firm that includes cost of debenture, cost of loan capital, cost of equity share capital, cost of preference share capital, cost of retained earnings etc.
Cost of Debentures:
The capital structure of a firm normally includes the debt capital. Debt may be in the form of debentures bonds, term loans from financial institutions and banks etc. The amount of interest payable for issuing debenture is considered to be the cost of debenture or debt capital (Kd).
Cost of debt capital is much cheaper than the cost of capital raised from other sources, because interest paid on debt capital is tax deductible.
The cost of debenture is calculated in the following ways:
When the debentures are issued and redeemable at par:
Kd = r (1 – t)
where Kd = Cost of debenture
r = Fixed interest rate
t = Tax rate
When debenture is issued at a premium or discount but redeemable then
Kd = I/NP (1 – t)
Kd= cost of debenture
I=Annual interest payment
t= tax rate
Np= net proceeds from issues of debenture.
When the debentures are redeemable at a premium or discount and are redeemable after ‘n’ period:
Kd = I(1-t) +1/N (Rv – NP) / ½ (RV – NP)
where Kd = Cost of debenture.
I = Annual interest payment
t = Tax rate
NP = Net proceeds from the issue of debentures
Ry = Redeemable value of debenture at the time of maturity
Example 1:
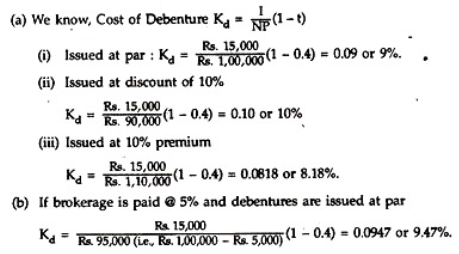
A company issues Rs. 1,00,000, 15% Debentures of Rs. 100 each. The company is in 40% tax bracket. You are required to compute the cost of debt after tax, if debentures are issued at (i) Par, (ii) 10% discount, and (iii) 10% premium.
If brokerage is paid at 5%, what will be the cost of debentures if issue is at par?
Cost of Preference Share Capital:
For preference shares, the dividend rate can be considered as its cost, since it is this amount which the company wants to pay against the preference shares. Like debentures, the issue expenses or the discount/premium on issue/redemption are also to be taken into account.
(i) The cost of preference shares (KP) = DP / NP
Where, DP = Preference dividend per share
NP = Net proceeds from the issue of preference shares.
(ii) If the preference shares are redeemable after a period of ‘n’, the cost of preference shares (KP) will be:

where NP = Net proceeds from the issue of preference shares
RV = Net amount required for redemption of preference shares
DP = Annual dividend amount.
There is no tax advantage for cost of preference shares, as its dividend is not allowed deduction from income for income tax purposes.
Example:
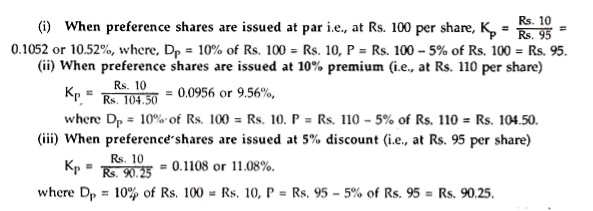
A company issues 10% Preference shares of the face value of Rs. 100 each. Floatation costs are estimated at 5% of the expected sale price.
What will be the cost of preference share capital (KP), if preference shares are issued (i) at par, (ii) at 10% premium and (iii) at 5% discount? Ignore dividend tax.
Solution:
We know, cost of preference share capital (KP) = DP/P
Cost of Equity or Ordinary Shares:
The funds required for a project may be raised by the issue of equity shares which are of permanent nature. These funds need not be repayable during the lifetime of the organization. Cost of equity share is calculated by considering the earnings of the company, market value of the shares, dividend per share and the growth rate of dividend or earnings.
(i) Dividend/Price Ratio Method:
The cost of equity share capital is computed on the basis of the present value of the expected future stream of dividends.
Thus, the cost of equity share capital (Ke) is measured by:
Ke = where D = Dividend per share
P = Current market price per share.
If dividends are expected to grow at a constant rate of ‘g’ then cost of equity share capital
(Ke) will be Ke = D/P + g.
This method is suitable for those entities where growth rate in dividend is relatively stable.
Example:
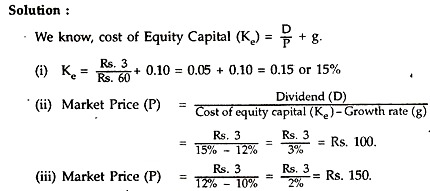
XY Company’s share is currently quoted in market at Rs. 60. It pays a dividend of Rs. 3 per share and investors expect a growth rate of 10% per year.
You are required to calculate:
(i) The company’s cost of equity capital.
(ii) The indicated market price per share, if anticipated growth rate is 12%.
(iii) The market price, if the company’s cost of equity capital is 12%, anticipated growth rate is 10% p.a., and dividend of Rs. 3 per share is to be maintained.
Earnings/Price Ratio Method:
The cost of equity share capital will be based upon the expected rate of earnings of a company. The argument is that each investor expects a certain amount of earnings whether distributed or not, from the company in whose shares he invests.
If the earnings are not distributed as dividends, it is kept in the retained earnings and it causes future growth in the earnings of the company as well as the increase in market price of the share.
Thus, the cost of equity capital (Ke) is measured by:
Ke = E/P where E = Current earnings per share
P = Market price per share.
If the future earnings per share will grow at a constant rate ‘g’ then cost of equity share capital (Ke) will be
Ke = E/P+ g.
This method is similar to dividend/price method. These costs are to be adjusted with the current market price of the share at the time of computing cost of equity share capital since the full market value per share cannot be realised. So, the market price per share will be adjusted by (1 – f) where ‘f’ stands for the rate of floatation cost.
Thus, using the Earnings growth model the cost of equity share capital will be:
Ke = E / P (1 – f) + g
Example
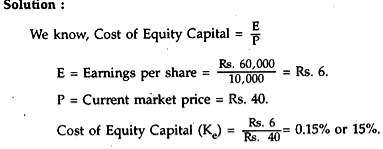
The share capital of a company is represented by 10,000 Equity Shares of Rs. 10 each, fully paid. The current market price of the share is Rs. 40. Earnings available to the equity shareholders amount to Rs. 60,000 at the end of a period.
Calculate the cost of equity share capital using Earning/Price ratio.
Cost of Retained Earnings:
When earnings are retained in the business, shareholders are forced to forego dividends. The dividends forgone by the equity shareholders are, in fact, an opportunity cost. Thus, retained earnings involve opportunity cost.
Q15) What is time value of money?
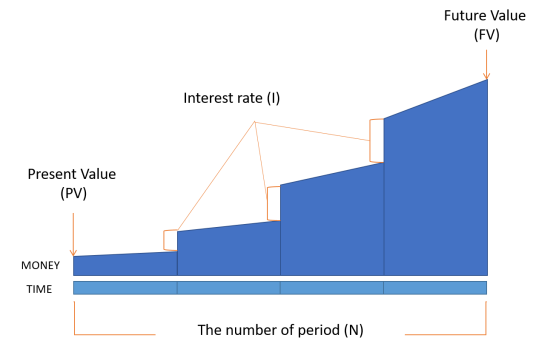
A15) It is the idea that money that is available at the present time is worth more than the same amount in the future, due to its potential earning capacity.
This core principle of finance holds that provided money can earn interest, any amount of money is worth more the sooner it is received.
One of the most fundamental concepts in finance is that money has a time value attached to it.
In simpler terms, it would be safe to say that a dollar was worth more yesterday than today and a dollar today is worth more than a dollar tomorrow.
That is
Future Money = Present Money + Time
There are five (5) variables that you need to know:
Q16) What are equity share? Write the advantages of it.
A16) The Equity Capital refers to that portion of the organization’s capital, which is raised in exchange for the share of ownership in the company. These shares are called the equity shares.
The equity shareholders are the owners of the company who have significant control over its management. They enjoy the rewards and bear the risk of ownership. However, their liability is limited to the amount of their capital contributions. The Equity Capital is also called as the share capital or equity financing.
Advantages: