Unit-4
Probability
Question-1: A bag contains 7 red and 8 black balls then find the probability of getting a red ball.
Sol.
Here total cases = 7 + 8 = 15
According to the definition of probability,

So that, here favourable cases- red balls = 7
Then,

Question-2: A box contains 4 white and 2 black balls and a second box contains three balls of each colour. Now a bag is selected at random and a ball is drawn randomly from the chosen box. Then what will be the probability that the ball is white?
Sol.
Here we have two mutually exclusive cases-
1. The first bag is chosen
2. The second bag is chosen
The chance of choosing the first bag is 1/2. And if this bag is chosen then the probability of drawing a white ball is 4/6.
So that the probability of drawing a white ball from the first bag is-

And the probability of drawing a white ball from the second bag is-

Here the events are mutually exclusive, then the required probability is-

Question-3: A die is rolled. If the outcome is a number greater than three. What is the probability that it is a prime number?
Sol.
The sample space is- S = {1, 2, 3, 4, 5, 6}
Let A be the event that an outcome is a number that is greater than three and B be the event that it is a prime.
So that-
A = {4, 5, 6} and B = {2, 3, 5} and hence 
P(A) = 3/6, P(B) = 3/6 and 
Now the required probability-


Question-4: Two male and female candidates appear in an interview for two positions in the same post. The probability that the male candidate is selected is 1/7 and the female candidate selected is 1/5.
What is the probability that-
1. Both of them will be selected
2. Only one of them will be selected
3. None of them will be selected.
Sol.
Here, P (male’s selection) = 1/7
And
P (female’s selection) = 1/5
Then-
1.

2.


3.

Question-5: A factory has two machines A and B making 60% and 40% respectively of the total production. Machine A produces 3% defective items, and B produces 5% defective items. Find the probability that a given defective part came from A.
SOLUTION: We consider the following events:
A: Selected item comes from A.
B: Selected item comes from B.
D: Selected item is defective.
We are looking for a  . We know:

Now,

So we need


Since D is the union of the mutually exclusive events  and
and  (the entire sample space is the union of the mutually exclusive events A and B)


Question-6: Three urns contain 6 red, 4 black; 4 red, 6 black; 5 red, 5 black balls respectively. One of the urns is selected at random and a ball is drawn from it. If the ball is drawn is red find the probability that it is drawn from the first urn.
Solution:
 : The ball is drawn from urnI.
 : The ball is drawn from urnII.
 : The ball is drawn from urnIII.
R: The ball is red.
We have to find 

Since the three urns are equally likely to be selected

Also,


From (i), we have

Question-7: Three urn contains 6 red, 4 black; 4 red, 6 black; 5 red, 5 black balls respectively. One of the urn is selected randomly and a ball is drawn from it.
If the ball drawn is red then find the probability that it is drawn from the first urn.
Sol.
Let,


Now we have to find- 
By using Bayes theorem-
 =
= 
Here three urns equally likely to be selected-
So that-

And-


So that-
 =
= 
Hence the required probability is 2/5.
Question-8: Find the probability distribution of the number of heads when three coins are tossed simultaneously.
Sol.
Let be the number of heads in the toss of three coints
The sample space will be-
{HHH, HHT, HTH, THH, HTT, THT, TTH, TTT}
Here variable X can take the values 0, 1, 2, 3 with the following probabilities-
P[X= 0] = P[TTT] = 1/8
P[X = 1] = P [HTT, THH, TTH] = 3/8
P[X = 2] = P[HHT, HTH, THH] = 3/8
P[X = 3] = P[HHH] = 1/8
Hence the probability distribution of X will be-
X |
|
|
|
|
P(x) |
|
|
|
|
Question-9: Find the expectations of the number of an unbiased die when thrown.
Sol. Let X be a random variable that represents the number on a die when thrown.
X can take the values-
1, 2, 3, 4, 5, 6
With
P[X = 1] = P[X = 2] = P[X = 3] = P[X = 4] = P[X = 5] = P[X = 6] = 1/6
The distribution table will be-
X | 1 | 2 | 3 | 4 | 5 | 6 |
p(x) | 1/6 | 1/6 | 1/6 | 1/6 | 1/6 | 1/6 |
Hence the expectation of number on the die thrown is-

So that-

Question-10: If a continuous random variable X has the following probability density function:

Then find-
1. P[0.2 < X < 0.5]
Sol.
Here f(x) is the probability density function, then-


Question-11: The probability density function of a variable X is
X | 0 | 1 | 2 | 3 | 4 | 5 | 6 |
P(X) | k | 3k | 5k | 7k | 9k | 11k | 13k |
(i) Find 
(ii) What will be e minimum value of k so that 
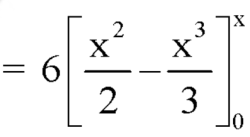
Solution. (i) If X is a random variable then


(ii)Thus minimum value of k=1/30.
Question-12: The pdf of a continuous random variable is given as below-

Then find the c.d.f. of X.
Sol.
The c.d.f. of X will be given by-


Hence the c.d.f will be-


Question-13: The overall percentage of failures in a certain examination is 20. If six candidates appear in the examination, what is the probability that at least five pass the examination?
Solution:
Probability of failures 

Probability 
Probability of at least five passes  P(5 or 6)


Question-14: A die is thrown 8 times and it is required to find the probability that 3 will show (i) Exactly 2 times
(ii) At least seven times (iii) At least once.
Solution:
The probability of throwing 3 in a single trial =
The probability of not throwing 3 in a single trial 
(i) P (getting 3 exactly 2 times)=P (getting 3, at 7 or 8 times) 
(ii) P (getting 3, at least seven times)=P (getting 3, at 7 or 8 times) 
(iii) P (getting 3 at least once)
=P (getting 4, at 1 or 2 or 3 or 4 or 5 or 6 or 7 or 8 times)

Question-15: Assume that the probability of an individual coal miner being killed in a mine accident during a year is . Use appropriate statistical distribution to calculate the probability that in a mine employing 200 metres, there will be at least one fatal accident in a year.
Solution:
 ,
, 

P(At least one)=P(1 or 2 or 3 or …. or 200)

Question-16: In a certain factory producing cycle tyres there is a small chance of 1 in 500 tyres to be defective. The tyres are supplied in lots of 10. Using Poisson distribution calculate the approximate number of lots containing no defective, one defective, and two defective tyres, respectively, in a consignment of 10000 lots.
Solution:


S.No | Probability of defective | Number of lots containing defective |
1 |
|
|
2 |
|
|
3 |
|
|
Question-17: On the final examination in mathematics, the mean was 72, and the standard deviation was 15. Determine the standard deviation scores of students receiving grades.
(a) 60 (b) 93 (c) 72
Solution:
(a)  (b)
(b)  (c)
(c) 
Question-18: The mean inside diameter of a sample of 200 washers produced by a machine is 0.0502 cm and the standard derivation is 0.005 cm. The purpose for which these washers are intended allows a maximum tolerance in the diameter of 0.496 to 0.508 cm, otherwise, the washers are considered defective. Determine the percentage of defective washers produced by the machine, assuming the diameters are normally distributed
Solution:


Area for non-defective washers Area between
  and
and 
= 2 Area between  and
and 

Percentage of defective washers

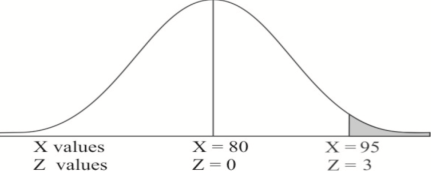
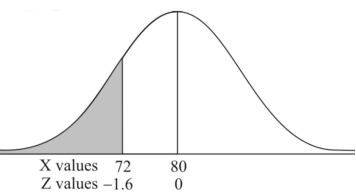
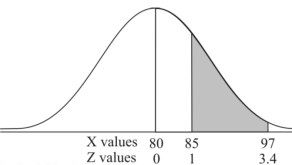
Question-19: If a random variable X is normally distributed with mean 80 and standard deviation 5, then find-
1. P[X > 95]
2. P[X < 72]
3. P [85 < X <97]
[Note- use the table- area under the normal curve]
Sol.
The standard normal variate is – 
Now-
1. X = 95,

So that-


2. X = 72,

So that-


3. X = 85,

X = 97,

So that-


Question-20: The life of electric bulbs is normally distributed with a mean of 8 months and a standard deviation of 2 months.
If 5000 electric bulbs are issued how many bulbs should be expected to need replacement after 12 months?
[Given that P (z ≥ 2) = 0. 0228]
Sol.
Here mean (μ) = 8 and standard deviation = 2
Number of bulbs = 5000
Total months (X) = 12
We know that-

Area (z ≥ 2) = 0.0228
Number of electric bulbs whose life is more than 12 months ( Z> 12)
= 5000 × 0.0228 = 114
Therefore replacement after 12 months = 5000 – 114 = 4886 electric bulbs.
Question-21: A manufacturer of electric bulbs claims that a certain pen manufactured by him has a mean life of at least 460 days. A purchasing officer selects a sample of 100 bulbs and put them on the test. The mean life of the sample was found 453 days with a standard deviation of 25 days. Should the purchasing officer reject the manufacturer’s claim at a 1% level of significance?
Sol.
Here the population mean = 
Sample size = n = 100
Sample mean = 
Sample standard deviation = S = 25
The null and alternative hypotheses will be-

Here alternative hypothesis is left tailed so that the test is left tailed test-
Here population standard deviation is unknown so that we should use a t-test if the life of the bulbs follows a normal distribution.
But it is not the case. Here sample size is 100 which is large.
Note- a sample size of more than 30 is considered a large sample.
So here we use Z-test-


The critical value of Z statistic at a 1% level of significance is = -2.33
Since the calculated value of the test statistic is less than the critical value that means the test statistic lies in the rejection region.
Therefore we reject the null hypothesis.
So that we reject the manufacturer’s claim at a 1% level of significance.
Question-22: A set of five similar coins is tossed 320 times and the result is
Number of heads | 0 | 1 | 2 | 3 | 4 | 5 |
Frequency | 6 | 27 | 72 | 112 | 71 | 32 |
Solution. For v = 5, we have 
P, probability of getting a head=1/2;q, probability of getting a tail=1/2.
Hence the theoretical frequencies of getting 0,1,2,3,4,5 heads are the successive terms of the binomial expansion 


Thus the theoretical frequencies are 10, 50, 100, 100, 50, 10.
Hence, 


Since the calculated value of  is much greater than
  the hypothesis that the data follow the binomial law is rejected.
Question-23: In experiments of pea breeding, the following frequencies of seeds were obtained
Round and yellow | Wrinkled and yellow | Round and green | Wrinkled and green | Total |
316 | 101 | 108 | 32 | 556 |
Theory predicts that the frequencies should be in proportions 9:3:3:1. Examine the correspondence between theory and experiment.
Solution. The corresponding frequencies are

Hence, 

For v = 3, we have 
Since the calculated value of  is much less than
  there is a very high degree of agreement between theory and experiment.
Question-24: A certain stimulus administered to each of 12 patients resulted in the following increases off blood pressure: 5, 2, 8, -1, 3, 0, -2, 1, 5, 0, 4, 6. Can it be concluded that the stimulus will in general be accompanied by an increase in blood pressure?
Solution. Let us assume that the stimulus administered to all 12 patients will increase the blood pressure. Taking the population to be normal with mean μ = 0 and S.D. 


Here 
For  , from table IV.
Since the  our assumptions are rejected i.e. the stimulus does not increase the B.P.
Question-25: A mechanism is making engine parts with an axle diameter of 0.7 inches. A random sample of 10 parts shows a mean diameter of 0.742 inches with a standard deviation of 0.04 inches. Based on this sample would you say that the work is inferior?
Solution. Here we have,
Taking the hypothesis that the product is not inferior that is there is no significant difference between  and μ.


Degree of freedom  = 10-1=9
For  we get from table IV,
As the calculated value of  the value of t is significant at a 5% level of significance. This implies that
  differs significantly from μ and the hypothesis is rejected. Hence the work is inferior. The work is inferior even at a 2% level of significance.
Question-26: In two large populations there are 30% and 25% respectively of fair-haired people. Is this difference likely to be hidden in samples of 1200 and 900 respectively from the two populations?
Solution. Here 

So that,.

Hence it is unlikely that the real difference will be hidden.
Question-27: In a sample of 600 men from a certain City 450 are found, smokers. In another sample of 900 men from another City, 450 are smokers. do the data indicate that the cities are significantly different with respect to the habit of smoking among men.
Solution.  number of smokers = 450,
 900 men, number of smokers = 450,


z>3 so that the difference is significant.
Question-28: From a random sample of 10 pigs fed on diet A. The increase in weight in a certain period were 10, 6, 16, 17, 13, 12, 8, 14, 15, 9 lbs. For another random sample of 12 pig’s fat on diet B, the increases in the same period were 7, 13, 22, 15, 12, 14, 18, 8, 21, 23, 10, 17 lbs. Test whether diets A and B differ significantly as regards their effects on weight increases?
Solution. We calculate the means and standard deviation of the samples as follows
| Diet A |
|
| Diet B |
|
|
|
|
|
|
|
10 | -2 | 4 | 7 | -8 | 64 |
6 | -6 | 36 | 18 | -2 | 4 |
16 | 4 | 16 | 22 | 7 | 49 |
17 | 5 | 25 | 15 | 0 | 0 |
13 | 1 | 1 | 12 | -3 | 9 |
12 | 0 | 0 | 14 | -1 | 1 |
8 | -4 | 16 | 18 | 3 | 9 |
14 | 2 | 4 | 8 | -7 | 49 |
15 | 3 | 9 | 21 | 6 | 36 |
9 | -3 | 9 | 23 | 8 | 64 |
|
|
| 10 | -5 | 25 |
|
|
| 23 | 2 | 4 |
120 | 0 | 120 | 10 | 0 | 314 |


Assuming that the samples do not differ in weight so far as two diets are concerned i.e. 
Hence, 
Here, 
For 
The calculated value of 
Hence the difference between the sample means is not significant that is the two diets do not differ significantly as regards their effects on the increase in weight.


