UNIT 4
Statistics & Probability
Q1) Find the mean of 26, 15, 29, 36, 35, 30, 14, 21, 25 .
A1)


Q2) Find the arithmetic mean of the following dataset.
Class | 0-10 | 10-20 | 20-30 | 30-40 | 40-50 |
Frequency | 7 | 8 | 20 | 10 | 5 |
A2)
Let the assumed mean (a) = 25,
Class | Mid-value | Frequency | x – 25 = d | Fd |
0-10 | 5 | 7 | -20 | -140 |
10-20 | 15 | 8 | -10 | -80 |
20-30 | 25 | 20 | 0 | 0 |
30-40 | 35 | 10 | 10 | 100 |
40-50 | 45 | 5 | 20 | 100 |
Total |
| 50 |
| -20 |

Q3) Find the mode of the following dataset-

A3)
Class interval | Frequency |
0 - 10 | 3 |
10 – 20 | 5 |
20 – 30 | 7 |
30 – 40 | 9 |
40 – 50 | 4 |
Here highest frequency is 9. So that the modal class is 40-50,
Put the values in the given data-


Hence the mode is 42.86
Q4) Find the quartile deviation of the following data-
Class interval | 0-10 | 10-20 | 20-30 | 30-40 | 40-50 |
Frequency | 3 | 5 | 7 | 9 | 4 |
A4)
Here N/4 = 28/4 = 7 so that the 7’th observation falls in the class 10 – 20.
And
3N/4 = 21, and 21’st observation falls in the interval 30 – 40 which is the third quartile.
The quartiles can be calculated as below-

And

Hence the quartile deviation is-

Q5) Find the mean deviation from mean of the following data-
Class interval | 0-6 | 6-12 | 12-18 | 18-24 | 24-30 |
Frequency | 8 | 10 | 12 | 9 | 5 |
A5)
Class interval | Mid-value | Frequency | d = x - a | f.d | |x - 14| | f |x - 14| |
0-6 | 3 | 8 | -12 | -96 | 11 | 88 |
6-12 | 9 | 10 | -6 | -60 | 5 | 50 |
12-18 | 15 | 12 | 0 | 0 | 1 | 12 |
18-24 | 21 | 9 | 6 | 54 | 7 | 63 |
24-30 | 27 | 5 | 12 | 60 | 13 | 65 |
Total |
| 44 |
| -42 |
| 278 |

Then mean deviation from mean-

Q6) Compute variance and standard deviation.
Class | Frequency |
0-10 | 3 |
10-20 | 5 |
20-30 | 7 |
30-40 | 9 |
40-50 | 4 |
A6)
Class | Mid-value (x) | Frequency (f) |  |
0-10 | 5 | 3 | 1470.924 |
10-20 | 15 | 5 | 737.250 |
20-30 | 25 | 7 | 32.1441 |
30-40 | 35 | 9 | 555.606 |
40-50 | 45 | 4 | 1275.504 |
Sum |
|  | 4071.428 |

Then standard deviation,

Q7) If coefficient of skewness is 0.64. Standard deviation is 13 and mean is 59.2, then find the mode and median.
A7)
We know that-

So that-


And we also know that-


Q8) Find the correlation coefficient between Age and weight of the following data-
Age | 30 | 44 | 45 | 43 | 34 | 44 |
Weight | 56 | 55 | 60 | 64 | 62 | 63 |
A8)
x | y |  |  |  |  | (   |
30 | 56 | -10 | 100 | -4 | 16 | 40 |
44 | 55 | 4 | 16 | -5 | 25 | -20 |
45 | 60 | 5 | 25 | 0 | 0 | 0 |
43 | 64 | 3 | 9 | 4 | 16 | 12 |
34 | 62 | -6 | 36 | 2 | 4 | -12 |
44 | 63 | 4 | 16 | 3 | 9 | 12 |
Sum= 240 |
360 |
0 |
202 |
0 |
70
|
32 |
Karl Pearson’s coefficient of correlation-

Here the correlation coefficient is 0.27.which is the positive correlation (weak positive correlation), this indicates that the as age increases, the weight also increase.
Q9) Compute the Spearman’s rank correlation coefficient of the dataset given below-
Person | A | B | C | D | E | F | G | H | I | J |
Rank in test-1 | 9 | 10 | 6 | 5 | 7 | 2 | 4 | 8 | 1 | 3 |
Rank in test-2 | 1 | 2 | 3 | 4 | 5 | 6 | 7 | 8 | 9 | 10 |
A9)
Person | Rank in test-1 | Rank in test-2 | d =  |  |
A | 9 | 1 | 8 | 64 |
B | 10 | 2 | 8 | 64 |
C | 6 | 3 | 3 | 9 |
D | 5 | 4 | 1 | 1 |
E | 7 | 5 | 2 | 4 |
F | 2 | 6 | -4 | 16 |
G | 4 | 7 | -3 | 9 |
H | 8 | 8 | 0 | 0 |
I | 1 | 9 | -8 | 64 |
J | 3 | 10 | -7 | 49 |
Sum |
|
|
| 280 |


Q10) Two variables X and Y are given in the dataset below, find the two lines of regression.
x | 65 | 66 | 67 | 67 | 68 | 69 | 70 | 71 |
y | 66 | 68 | 65 | 69 | 74 | 73 | 72 | 70 |
A10)
The two lines of regression can be expressed as-

And

x | y |  |  | Xy |
65 | 66 | 4225 | 4356 | 4290 |
66 | 68 | 4356 | 4624 | 4488 |
67 | 65 | 4489 | 4225 | 4355 |
67 | 69 | 4489 | 4761 | 4623 |
68 | 74 | 4624 | 5476 | 5032 |
69 | 73 | 4761 | 5329 | 5037 |
70 | 72 | 4900 | 5184 | 5040 |
71 | 70 | 5041 | 4900 | 4970 |
Sum = 543 | 557 | 36885 | 38855 | 37835 |
Now-

And

Standard deviation of x-


Similarly-


Correlation coefficient-


Put these values in regression line equation, we get
Regression line y on x-


Regression line x on y-


Q11) A box contains 4 white and 2 black balls and a second box contains three balls of each colour. Now a bag is selected at random and a ball is drawn randomly from the chosen box. Then what will be the probability that the ball is white.
A11)
Here we have two mutually exclusive cases-
1. The first bag is chosen
2. The second bag is chosen
The chance of choosing the first bag is 1/2. And if this bag is chosen then the probability of drawing a white ball is 4/6.
So that the probability of drawing a white ball from first bag is-

And the probability of drawing a white ball from second bag is-

Here the events are mutually exclusive, then the required probability is-


Q12) A die is rolled. If the outcome is a number greater than three. What is the probability that it is a prime number.
A12)
The sample space is- S = {1, 2, 3, 4, 5, 6}
Let A be the event that the outcome is a number which is greater than three and B be the event that it is a prime.
So that-
A = {4, 5, 6} and B = {2, 3, 5} and hence 
P(A) = 3/6, P(B) = 3/6 and 
Now the required probability-


Q13) A person speaks truth 3 out of 4 times. A die is thrown. She reports that there is five. What is the chance there is 5.
A13)
Let  be the event that the person speak truth,
  be the event that she tells lie and A be the event that she reports a five.
So that-
By the law of total probability-


Now we have to find- 
By using Bayes theorem-
 =
= 
 =
= 
Which is the required probability.
Q14) If the percentage of failure in a test is 20. If six students appear in the test, then what will be the probability that at least five students will pass the test?
A14)
Here


Then the probability of at least five students will pass the test-


Q15) If cars arriving at workshop follow the Poisson distribution. If the average number of cars arrivals during a specified period of an hour is 2.
Find the probabilities that during the given hour-
1. No car arrive
2. At least two cars arrive.
A15)
Here the average of car arrivals is - 2
So that mean = 2

Let X be the number of cars arriving during the given hour,
By using Poisson distribution, we get-

So that the required probability-
1. P [no car will arrive] = P [X = x] = 
2. P [At least two cars will arrive] = P [X≥2] = P [X =2] + P [X = 3] + ……….
= 1 - P [[X =1] + P [X =0]]


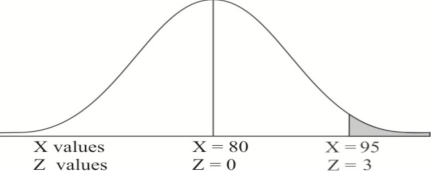
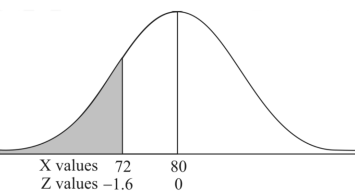
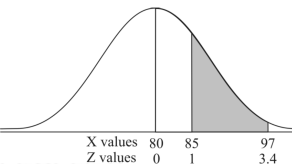
Q16) If a random variable X is normally distributed with mean 80 and standard deviation 5, then find-
1. P[X > 95]
2. P[X < 72]
3. P [85 < X <97]
[Note- use the table- area under the normal curve]
A16)
The standard normal variate is – 
Now-
1. X = 95,

So that-


2. X = 72,

So that-


3. X = 85,

X = 97,

So that-


Q17) The mean inside diameter of a sample of 200 washers produced by a machine is 0.0502 cm and the standard deviation is 0.005 cm. The purpose for which these washers are intended allows a maximum tolerance in the diameter of 0.496 to 0.508 cm, otherwise the washers are considered defective. Determine the percentage of defective washers produced by the machine, assuming the diameters are normally distributed.
A17)
Here-

And

Area for non-defective washers = area between z = -1.2 to +1.2
= 2 area between z = 0 and z = 1.2
= 2 × 0.3849 = 0.7698 = 76.98%
Then percent of defective washers = 100 – 76.98 = 23.02 %
Q18) A company has replaced its original technology of producing electric bulbs by CFL technology. The company manager wants to compare the average life of bulbs manufactured by original technology and new technology CFL. Write appropriate null and alternate hypotheses
A18)
Let the average life of original and CFL technology bulbs are denoted by  and
and  .
.
The null and alternative hypotheses will be-


Here the alternate hypothesis is two tailed so that the test will also be two tailed.
If the manager is interested just to know whether average life of CFL is greater than the original technology bulbs then the null and alternative hypotheses will be-


Here the alternative hypothesis is left tailed so that the corresponding test will also be left tailed.
Q19) A manufacturer of electric bulbs claims that a certain pen manufactured by him has a mean life at least 460 days. An purchasing officer selects a sample of 100 bulbs and put them on the test. The mean life of the sample found 453 days with standard deviation 25 days. Should the purchasing officer reject the manufacturer’s claim at 1% level of significance?
A19)
Here the population mean = 
Sample size = n = 100
Sample mean = 
Sample standard deviation = S = 25
The null and alternative hypotheses will be-

Here alternative hypothesis is left tailed so that the test is left tailed test-
Here population standard deviation is unknown so that we should use t-test if life of the bulbs follows normal distribution.
But it is not the case. Here sample size is 100 which is large.
Note- sample size more than 30 is considered as large sample.
So here we use Z-test-


Critical value of Z statistic at 1% level of significance is = -2.33
Since the calculated value of test statistic is less than the critical value that means test statistic lies in rejection region.
Therefore we reject the null hypothesis.
So that we reject the manufacturer’s claim at 1% level of significance.
Q20) The12 measurements of the same object on an instrument are given below-
1.6, 1.5, 1.3, 1.5, 1.7, 1.6, 1.5, 1.4, 1.6, 1.3, 1.5, 1.5
If the measurement of the instrument follows normal distribution then carry out the test at 1% level of significance that variance in the measurement of the instrument is less than 0.016.
A20)
Here the sample size = n = 12
Specified value of population variance under test = 
Here we want to test that the variance is the measurement of the instrument is less than 0.016.
The null and alternative hypotheses are-

Here the alternative hypothesis is left tailed then the test is also left tailed test.
Sample size is small and the measurement of the instruments follows normal distribution so that we will use chi-square test for population variance.
The test statistic of chi-square test is defined as-

X |  |  |
1.6 | 0.1 | 0.01 |
1.5 | 0 | 0 |
1.3 | -0.2 | 0.04 |
1.5 | 0 | 0 |
1.7 | 0.2 | 0.04 |
1.6 | 0.1 | 0.01 |
1.5 | 0 | 0 |
1.4 | -0.1 | 0.01 |
1.6 | 0.1 | 0.01 |
1.3 | -0.2 | 0.04 |
1.5 | 0 | 0 |
1.5 | 0 | 0 |
Sum = 18 | 0 | 0.16 |
From the table-
Mean= 18/12 = 1.5
And

The critical value of the test statistic at 5% level of significance is = 4.57.
Here the calculated value of test statistic is greater than the critical value.
That means the value of test statistic lies in non-rejection region so that we do not reject the null hypothesis. Hence we reject the claim at 5% level of significance
We conclude that the variance in the measurement of the instruments is not less than 0.016.