Unit - 2
Orthogonal Frequency Division Multiplexing
Q1) What are the benefits of using of OFDM?
A1) The Orthogonal Frequency Division Multiplexing (OFDM) transmission scheme is the optimum version of the multicarrier transmission scheme. In the past, as well as in the present, the OFDM is referred in the literature Multi-carrier, Multi-tone and Fourier Transform.
- In mid-1960 parallel data transmission and frequency multiplexing came. In high-speed digital communication OFMD is employed. OFMD has a drawback of massive complex computation and high-speed memory which are no more problems now due to introduction of DSP and VLSI.
- The implementation of this technology is cost effective as FFT eliminates array of sinusoidal generators and coherent demodulation required in parallel data systems· The data to be transmitted is spread over large number of carriers. Each of them is then modulated at low rates. By choosing proper frequency between them the carriers are made orthogonal to each other.
- In OFDM the spectral overlapping among the sun carrier is allowed, at the receiver due to orthogonality the subcarriers can be separated. This provides better spectral efficiency and use to steep BPF is eliminated.
- The problems arising in single carrier scheme are eliminated in OFDM transmission system. It has the advantage of spreading out a frequency selective fade over many symbols. This effectively randomizes burst errors caused by fading or impulse interference so that instead of several adjacent symbols being completely destroyed, many symbols are only slightly distorted.
- Because of this reconstruction of majority of them even without forward error correction is possible. As the entire bandwidth is divided into many narrow bandwidths, the sub and become smaller than the coherent bandwidth of the channel which makes the frequency response over individual sub bands is relatively flat. Hence, equalization becomes much easier than in single carrier system and it can be avoided altogether if differential encoding is employed.
- The orthogonality of sub channels in OFDM can be maintained and individual subchannels can be completely separated by the FFT at the receiver when there are no inter symbol interference (ISI) and intercarrier interference (ICI) introduced by the transmission channel distortion.
- Since the spectra of an OFDM signal is not strictly band limited, linear distortions such as multipath propagation causes each subchannel to spread energy into the adjacent channels and consequently cause ISI.
- One way to prevent ISI is to create a cyclically extended guard interval, where each OFDM symbol is preceded by a periodic extension of the signal itself. When the guard interval is longer than the channel impulse response or multipath delay, the ISI can be eliminated.
- By using time and frequency diversity, OFDM provides a means to transmit data in a frequency selective channel. However, it does not suppress fading itself. Depending on their position in the frequency domain, individual subchannels could be affected by fading.
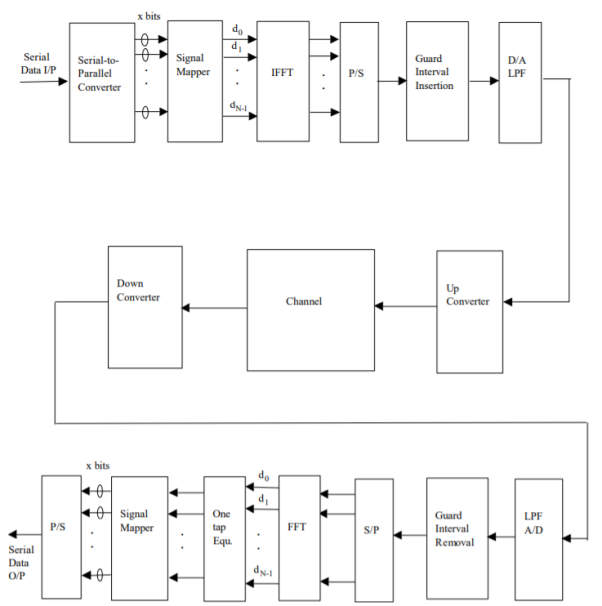
Fig 1: General OFDM System
The incoming signal is converted to parallel form by serial to parallel converter. After that it is grouped in x bits to form a complex number. These numbers are then modulated in a baseband manner by IFFT. Then through parallel to serial converted they are converted to serial data and transmitted. In order to avoid inter symbol interference a guard interval is inserted between the symbols. The discrete symbols are converted to analog and lowpass filtered for RF up-conversion. The receiver performs the inverse process of the transmitter. One tap equalizer is used to correct channel distortion. The tap coefficients of the filter are calculated based on channel information.
Q2) How is OFDM implemented in real world?
A2) Orthogonal frequency division multiplexing can accommodate high data rate in the mobile wireless systems in order to handle multimedia services. It is important to understand the OFDM technology because the channel estimation is an integral part of OFDM system. OFDM technology can be used effectively to avoid the effect of frequency-selective fading and narrowband interference from parallel closely spaced frequencies in mobile networks. If there is no orthogonality in the channel, inter-channel interference (ICI) can be experienced. With these vital advantages, OFDM technology has been widely used by many wireless standards such as WLAN, WMAN, and DVB. In OFDM scheme, complex filters are not required and time-spreading can be used without any complications in OFDM scheme.
OFDM scheme can also help to manage the single frequency networks (SFN) by sending the same signals at the same frequency using adjacent transmitters without interfering each other. OFDM has been popularly used for various wireless communication systems such as fourth generation 4G wireless system. Since we want to test and evaluate the use of Digital Prolate Spheroidal Sequences based on OFDM technology, we give a brief introduction to OFDM system. Orthogonal frequency-division multiplexing (OFDM) is based on the frequency division multiplexing (FDM) scheme used as digital multi-carrier modulation method, particularly in estimating a channel in two-dimensions (time – frequency lattice). The technology is intended for downlink in the physical layer. The OFDM channel is divided into several narrowband sub-carriers and designed to be orthogonal with each other in the frequency domain for carrying data symbols.
Each sub-carrier has parallel narrow band-pass channels at low symbol rate. The advantage of using a low symbol rate is that it is possible to use a guard interval between symbols and to avoid the inter-symbol interference. In the OFDM the total data rate for sub-carriers are equivalent to the single carrier modulation with the same bandwidth. The OFDM plays an important role in the wideband of mobile wireless systems.
Q3) How the capacity of information transmitted in SISO are calculated?
A3) Capacity is maximum possible information that can be transmitted with available bandwidth and transmitted power. In single antenna SISO having bandwidth B, transmitted power P, noise spectrum No and channel assumed to be white Gaussian, then the capacity of a system is given by Shannon’s capacity formula
C=B log2 (1+SNR)
When multiple antennas are used, channel faces multiple input and output, and its capacity is determined by extended Shannon’s capacity. Antenna with Nt input from transmitter and Nr output in a receiver channel is expressed as Nr * Nt matrix of channel H The capacity of a MIMO channel can be estimated by the following equation
C = log2 det (I +  )
)
Where H is Nr x Nt channel matrix, Rx is covariance of input signal x, HH is transpose conjugate of H matrix and is the variance of the uncorrelated and Gaussian noise [16]. Since this equation is obtained by large theoretical calculations, but practically it has never been achieved yet. To achieve more precise results linear transformation at both transmitter and receiver can be performed by converting MIMO channel (Nr, Nt) to a SISO sub channel min (Nr, Nt). According to singular value decomposition (SVD) every matrix can be decomposed. Suppose the channel matrix H transformation is given by H = UDVH, Where the matrix U is Nr x Nr matrix, V is Nc x Nc matrix and D is non-negative diagonal matrix of Nr x Nt.
Therefore, capacity of N SISO subchannels is sum of individual capacity and results the total MIMO capacity. MIMO capacity varies for different numbers of transmit antennas and receiver antennas. The MATLAB program can calculate the theoretical MIMO capacity of 200 random MIMO channels of different sizes at an SNR of 3 dB. We consider the case a transmitter that does not have the MIMO channel knowledge. Hence, each transmit antenna is allocated the same signal power  Additionally, the channel noises are assumed to be independent additive white Gaussian with variance
  . The entries in the MIMO channel matrix H are randomly generated from Gaussian distribution of zero mean and unit variance. Because the channels are random for M transmit antennas and N receive antennas, the MIMO capacity per y transmission is
C = ½ log [IN +  HHT]
HHT]
Because the entries in the MIMO channel Matrix H are randomly generated, its corresponding capacity is also random. From the 200 channels, each N x M MIMO configuration should generate 200 different capacity values. The BER is calculated with respect to single input single output (1 x1) system, single transmitter two receivers (1 x 2), single transmitter and four receivers (1 x 4). The BER analysis and MATLAB simulation expresses that the value of BER is decreasing as the number of receiver antennas are increasing. For the perfect MIMO OFDM system, the BER should be decreased and channel capacity should be increased. The orthogonal nature of the ODDM signal is also simulated. The MIMO OFDM system are the boon for 4G and next generation of the wireless communication systems.
Q4) What are the benefits of MIMO technology?
A4) The benefits of MIMO technology that help achieve such significant performance gains are array gain, spatial diversity gain, spatial multiplexing gain and interference reduction. These gains are described in brief below.
Array gain
Array gain is the increase in receive SNR that results from a coherent combining effect of the wireless signals at a receiver. The coherent combining may be realized through spatial processing at the receive antenna array and/or spatial pre-processing at the transmit antenna array. Array gain improves resistance to noise, thereby improving the coverage and the range of a wireless network.
Spatial diversity gain
As mentioned earlier, the signal level at a receiver in a wireless system fluctuates or fades. Spatial diversity gain mitigates fading and is realized by providing the receiver with multiple (ideally independent) copies of the transmitted signal in space, frequency or time. With an increasing number of independent copies (the number of copies is often referred to as the diversity order), the probability that at least one of the copies is not experiencing a deep fade increases, thereby improving the quality and reliability of reception. A MIMO channel with MT transmit antennas and MR receive antennas potentially offers MTMR independently fading links, and hence a spatial diversity order of MTMR.
Spatial multiplexing gain
MIMO systems offer a linear increase in data rate through spatial multiplexing, i.e., transmitting multiple, independent data streams within the bandwidth of operation. Under suitable channel conditions, such as rich scattering in the environment, the receiver can separate the data streams. Furthermore, each data stream experiences at least the same channel quality that would be experienced by a single-input single-output system, effectively enhancing the capacity by a multiplicative factor equal to the number of streams. In general, the number of data streams that can be reliably supported by a MIMO channel equals the minimum of the number of transmit antennas and the number of receive antennas, i.e., min{MT ,MR}. The spatial multiplexing gain increases the capacity of a wireless network
Interference reduction and avoidance
Interference in wireless networks results from multiple users sharing time and frequency resources. Interference may be mitigated in MIMO systems by exploiting the spatial dimension to increase the separation between users. For instance, in the presence of interference, array gain increases the tolerance to noise as well as the interference power, hence improving the signal-to-noise-plus-interference ratio (SINR). Additionally, the spatial dimension may be leveraged for the purposes of interference avoidance, i.e., directing signal energy towards the intended user and minimizing interference to other users. Interference reduction and avoidance improve the coverage and range of a wireless network. In general, it may not be possible to exploit simultaneously all the benefits described above due to conflicting demands on the spatial degrees of freedom. However, using some combination of the benefits across a wireless network will result in improved capacity, coverage and reliability.
Q5) With the help of block diagram explain the MIMO technology?
A5) Figure shows the basic building blocks that comprise a MIMO communication system. The information bits to be transmitted are encoded (using, for instance, a convolutional encoder) and interleaved. The interleaved codeword is mapped to data symbols (such as quadrature amplitude modulation or QAM symbols) by the symbol mapper. These data symbols are input to a space–time encoder that outputs one or more spatial data streams. The spatial data streams are mapped to the transmit antennas by the space–time precoding block. The signals launched from the transmit antennas propagate through the channel and arrive at the receive antenna array.
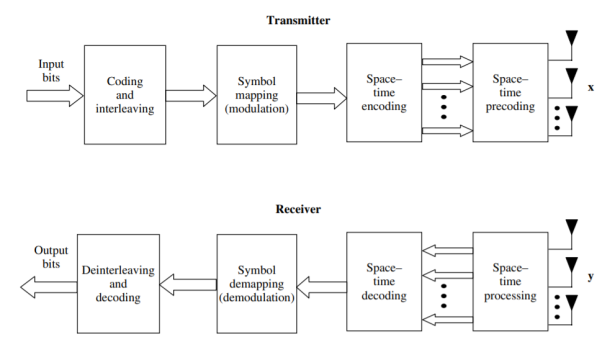
Figure.2 Diagram of a complex equivalent baseband MIMO communication system. x and y stand for the transmitted and received signal vectors respectively.
The receiver collects the signals at the output of each receive antenna element and reverses the transmitter operations in order to decode the data: receive space–time processing, followed by space–time decoding, symbol demapping, deinterleaving and decoding. Each of the building blocks offers the opportunity for significant design challenges and complexity–performance trade-offs. Furthermore, a number of variations can exist in the relative placement of the blocks, the functionality and the interactions between the blocks.
Q6) What is the signal model of MIMO-OFDM systems explain?
A6) To find the signal model of MIMO-OFDM system, we can follow the same approach as utilized in the SISO case. Because of the increased number of antennas, the signal dimension is changed. For instance, the transmitted signal on the k-th subcarrier in a MIMO system is an Nt × 1 vector, instead of a scalar in the SISO case. For brevity of presentation, the same notations are used for both the SISO and MIMO cases. But they are explicitly defined in each case. There are Nt transmit antennas and hence on each of the N subcarriers, Nt modulated signals are transmitted simultaneously. Denote  (m) and
  (mN + k) as the m-th modulated OFDM symbol in frequency domain and the k-th modulated subcarrier respectively as
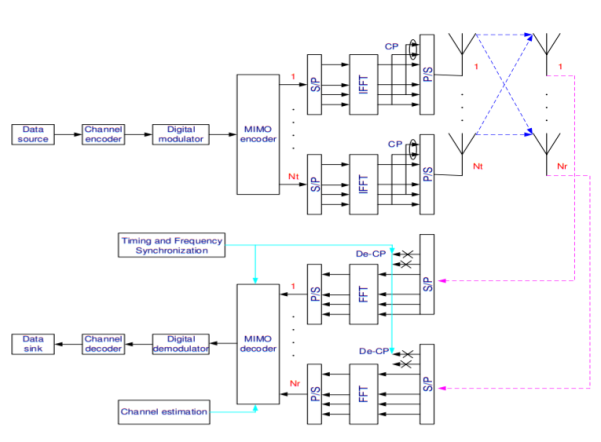
Fig 3 MIMO-OFDM System model

Where Sj (mN + k) represents the k-th modulated subcarrier for the m-th OFDM symbol transmitted by the j-th antenna. And it is normalized by a normalization factor KMOD so that there is a unit normalized average power for all the mappings. Taking IFFT of  (m) as a baseband modulation, the resulting time-domain samples can be expressed as


Here IFFT is a block-wise operation since each modulated subcarrier is a column vector and the generalized NNt-point IFFT matrix is a Kronecker product of FN and INt. This is just a mathematical expression. In the real OFDM systems, however, the generalized IFFT operation is still performed by Nt parallel N-point IFFT. To
Eliminate the ISI and the ICI, a length-Ng (Ng ≥ L) CP is prepended to the time domain samples per branch. The resulting OFDM symbol  (m) is denoted as


The time-domain samples denoted by ~u(m) may be directly converted to RF for transmission or be up-converted to IF first and then transmitted over the wireless MIMO channel. For the MIMO channel, we assume in this thesis that the MIMOOFDM system is operating in a frequency-selective Rayleigh fading environment and that the communication channel remains constant during a frame transmission, i.e., quasi-static fading. Suppose that the channel impulse response can be recorded with L time instances, i.e., time samples, then the multipath fading channel between the j-th TX and i-th RX antenna can be modeled by a discrete-time complex baseband equivalent (L − 1)-th order FIR filter with filter coefficients hij (l, m), with l ⊆ {0, . . . , L − 1} and integer m > 0. As assumed in SISO case, these CIR coefficients {hij (0, m), . . . , hij (L − 1, m)} are independent complex zero-mean Gaussian RV’s with variance 1 2Pl per dimension. The total power of the channel power delay profile {P0, . . . ,PL−1} is normalized to be σ 2c = 1. Let hm be the CIR matrix and denote hl,m as the l-th matrix-valued CIR coefficient.

In addition, we assume that those NtNr geographically co-located multipath channels are independent in an environment full of scattering. In information-theoretic point of view, it guarantees the capacity gain of MIMO systems. For the practical MIMO-OFDM systems, it enforces a lower limit on the shortest distance between multiple antennas at a portable receiver unit. If the correlation between those channels exists, the diversity gain from MIMO system will be reduced and hence system performance is degraded. At the receive side, an Nr-dimensional complex baseband equivalent receive signal can be obtained by a matrix-based discrete-time convolution as


The expected signal-to-noise ratio (SNR) per receive antenna is Nt σ2v. In order to have a fair comparison with SISO systems, the power per TX antenna should be scaled down by a factor of Nt . By stacking the received samples at discrete time instances,  (m) can be described by


Where hm,Cir is an NNr × NNt block circulant matrix. In general, an NNr × NNt block circulant matrix is fully defined by its first NNr × Nt block matrices. In our case, hm,Cir is determined by

Finally taking FFT on the  (m) at the receiver, we obtain the frequency domain MIMO-OFDM baseband signal model


In the above expression, V~ (m) represents the frequency domain noise, which is i.i.d. (independent and identically distributed) zero-mean and complex Gaussian random variable with variance 1/2 σ 2v per dimension, and Hm,diag is a block diagonal matrix which is given by

The k-th block diagonal element is the frequency response of the MIMO channel at the k-th subcarrier and can be shown to be


This leads to a flat-fading signal model per subcarrier and it is similar to the SISO signal model, except that Hk,m is an Nr × Nt matrix.
Q7) Explain the 3GPP MIMO channel model?
A7) Table below presents the channel parameters for the I-METRA MIMO channel that had been proposed in 3GPP. UE (User Equipment) and Node B in this table refers to the MS (mobile station) and BS (base station), respectively. Case A corresponds to the frequency-nonselective Rayleigh fading environment without any correlation among all antenna elements, which can be used as a simple reference model. Case B and Case C deal with the typical urban macrocell environment with the different delay spread, in which each delay component is coming from the same AoA. Case D models the microcell and bad urban environments with each delay component from the different AoA. We assume that all channel taps (paths) are subject to Rayleigh fading. In order to model the LOS situation, however, the first tap of the channel models for Case B and Case C may be subject to Rician fading. Meanwhile, the different PDPs of ITU mobility model are employed for the different cases.
For 4X4 MIMO channel model with antenna spacing of 0.5 in Table, the complex spatial correlation matrices in the BS and MS are found. For the different cases in Table where BS and MS have the different spatial characteristics in terms of PAS and AoA, the specific spatial correlation matrices are given as follows:
Case B: BS with Laplacian PAS for AS =50 and AoA =200, MS with Uniform PAS for AoA =22.50


Case C: BS with Laplacian PAS for AS = 100 and AoA = 200, MS with Laplacian PAS for AS=350 and AoA = 67.50
|
| Case A Rayleigh uncorrelated | Case B Macrocell | Case C macrocell | Case D microcell/bad-urban |
| Number of paths | 1 | 4 | 6 | 6 |
| PDP | N/A | ITU Pedestrian A | ITU Vehicular A | ITU Pedestrian B |
| Doppler spectrum | Classical | Classical | Laplacian | Laplacian |
| Speed(km/h) | 3/40/120 | 3/40/120 | 3/40/120 | 3/40/120 |
UE (MS) | Topology | N/A | 0.5 spacing | 0.5 spacing | 0.5 spacing |
PAS | N/A | Path#1, Rician K=6dB 9uniform over 360°) | Laplacian AS=35° (uniform over 360°) | Laplacian AS=35° (uniform over 360°) | |
DoM(deg) | N?A | 0 | 22.5 | -22.5 | |
AoA(deg) | N/A | 22.5(all paths) | 67.5(all paths) | 22.5 (odd paths) -67.5 even paths) | |
Node B (BS) | Topology | N/A | ULA: (1) 0.5 spacing (2) 4.0 spacing | ULA: (1) 0.5 spacing (2) 4.0 spacing | ULA: (1) 0.5 spacing (2) 4.0 spacing |
PAS | N/A | Laplacian AS=5° | Laplacian AS=10° | Laplacian AS=15° | |
AoA(deg) | N/A | 20,50° | 20,50° | 2,-20,10,-8,-3,3  |


Case D: BS with Laplacian PAS for AS = 150 and AoA =200, MS with Laplacian PAS for AS = 350 and AoA = 22.50/-67.50 (even path/odd path)


Q8) What is spatial correlation of Ray-Based channel Model?
A8) In general, the channel coefficients of two antenna elements can be correlated both in the temporal and spatial domains. Spatial correlation is the cross-correlation of the signals that originate from the same source and are received at two spatially separated antenna elements. Consider a spatial channel model for the uniform linear array antenna in which all antenna elements are equally spaced apart with a distance of d, as illustrated in Figure below. Here, spatial correlation between two adjacent antenna elements for the nth path is given by


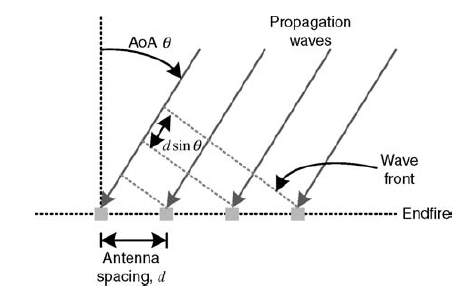
Figure 4 Signal model for uniform linear array (ULA) antenna
Q9) What is the difference between Rician fading in SISO and in MIMO?
A9) In contrast with Rician fading in the SISO channel, a phase change in each LOS path between the different antennas must be taken into account for modeling a Rician fading process in the MIMO channel. As shown in Figure below, the Rician fading process can be modeled by the sum of two matrices, each of which are weighed by the power ratio between the LOS signal and the scattered signal, respectively. A matrix for the Rician fading channel of the first path, H1, can be represented as

Where P1 denotes the average power of the first path and K is a power ratio of the LOS to Rayleigh components. Furthermore, HLOS represents the LOS component, which is defined as

Where α is an angle between the Direction-of-Movement (DoM) and LOS component. Meanwhile, drx and dtx denote the antenna spacing in the receiver and transmitter, respectively. Furthermore, AoArx and AoDtx represent the Angle-of-Arrival at the receiver and the Angle-of-Departure at the transmitter, respectively.
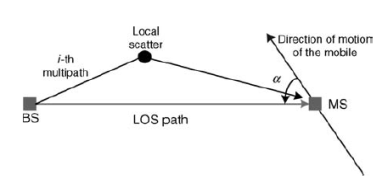
Figure 5 Signal model for a Rician fading MIMO channel.
Q10) Draw and explain Functional block diagram for I-METRA MIMO channel model?
A10) I-METRA (Intelligent Multi-element Transmit and Receive Antennas) MIMO channel model has been proposed by a consortium of the industries and universities, including Nokia. It is based on a stochastic MIMO channel model, which generates a correlated MIMO fading channel using the spatial correlation derived for ULA (Uniform Linear Array) subject to a single or multiple clusters with the Uniform Truncated Gaussian, or Truncated Laplacian PAS.
In the current discussion, the Truncated Gaussian and Truncated Laplacian PAS models are simply referred to as Gaussian and Laplacian PAS, respectively. The overall procedure for the I-METRA MIMO channel modeling consists of two main steps as shown in Figure. In the first step, the BS and MS spatial correlation matrices (RBS and RMS) and normalization factor are determined for the specified channel configuration, including the number of BS and MS antennas, antenna spacing, the number of clusters, PAS, AS, and AoA.
The spatial correlation matrix R for uplink or downlink is determined. In the second step, a symmetric mapping matrix Cis found by Equation above and then, the correlated fading MIMO channel is generated by multiplying it by the power per path and the uncorrelated fading signal. Once the correlated MIMO channel coefficients are generated for each path by following the procedure in Figure, the overall MIMO channel is simulated by using a tapped delay line.
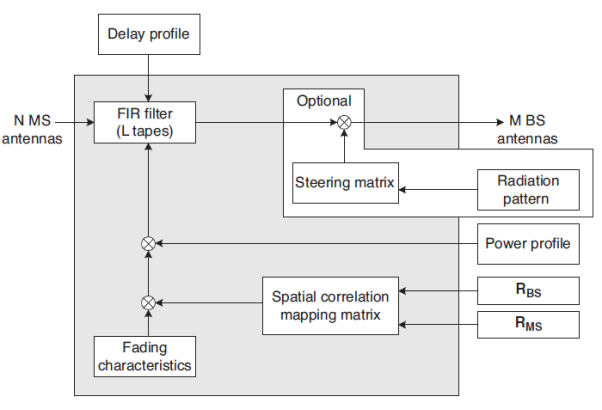
Figure 6 Functional block diagram for I-METRA MIMO channel model
Figure above shows a functional block diagram that implements the overall MIMO channel characteristics, taking the delay and power profiles into account. Here, an uncorrelated fading channel is generated with the pre-stored Doppler spectrum. It is multiplied by a spatial correlation mapping matrix to generate a correlated fading channel. The given PDP characteristics are implemented by passing the correlated fading signal through a FIR filter that is designed to satisfy the given average power and delay specification for each path. Furthermore, antenna radio pattern can be adjusted by generating a steering matrix. Some of these attributes are detailed in the sequel.
Q11) Explain the Statistical Model of Correlated MIMO Fading Channel?
A11) Consider a MIMO system with a base station of M antennas and the mobile stations of N antennas as illustrated in Figure. Narrowband MIMO channel H can be statistically expressed with an M X N matrix.

Where Al is the complex channel gain matrix for the lth path with delay  1. Let αlmn be the channel coefficient between the mth BS antenna and the nth MS antenna for the lth path. Assume that αlmn is zero-mean complex Gaussian-distributed, and thus, |αlmn |is Rayleigh-distributed. The complex channel gain matrix Al in Equation is given as

The relation between the MS and BS signals can be expressed as

Consider a downlink of MIMO system in Figure. As the antenna spacing at BS is relatively small when Tx and Rx are sufficiently apart, the spatial correlation at MS does not depend on the Tx antenna. In other words, spatial correlation at MS is independent of BS antennas. Then, the correlation coefficient of a channel gain for two different MS antennas, n1 and n2, can be expressed as

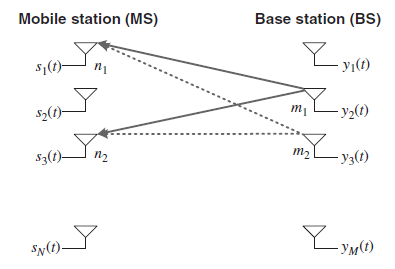
Figure 7 Downlink MIMO System

For the MS in an environment surrounded by local scatters, the spatial correlation becomes negligible when the MS antennas are separated by more than  =2. In spite of such a theory, however, the experimental results often show that the channel coefficients with the antennas separated by
  =2 can be highly correlated in some situations, especially in an indoor environment. Let us define a symmetric spatial correlation matrix for the MS as

Note that a diagonal component of RMS corresponds to the auto-correlation, which is always given by a correlation coefficient of one. Meanwhile, consider a typical urban environment, where there are no local scatters in the vicinity of the BS antennas, as opposed to MS antennas surrounded by the local scatters. It is attributed to the fact that the BS antennas are usually elevated above the local scatters so as to reduce the path loss. In this case, the PAS at the BS is subject to a relatively narrow beamwidth. Consider an uplink MIMO system in Figure. As long as Tx and Rx are sufficiently apart, all MS antennas that are closely co-located tend to have the same radiation pattern, illuminating the same surrounding scatters. Then, it also makes the spatial correlation of BS antennas independent of MS antennas and thus, the
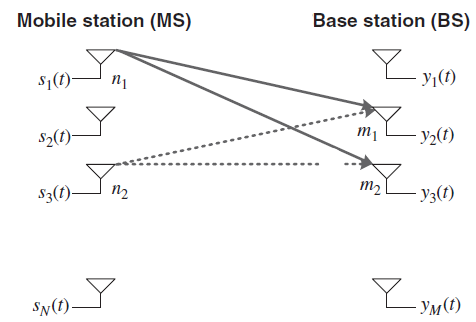
Fig 8 Uplink MIMO System correlation coefficient of a channel gain for two different BS antennas, m1 and m2, can be expressed as

Let us define the spatial correlation matrix for the BS as

In order to generate the channel gain matrix Al in Equation above, information on the channel correlation between the Tx and Rx antennas is required. In fact, the spatial correlation matrices at BS and MS, RBS and RMS, do not provide sufficient information to generate Al . In fact, as illustrated in Figure below, the correlation of coefficients between the pairs of Tx and Rx, αm1n1 and αm2n2, is additionally required, i.e.,


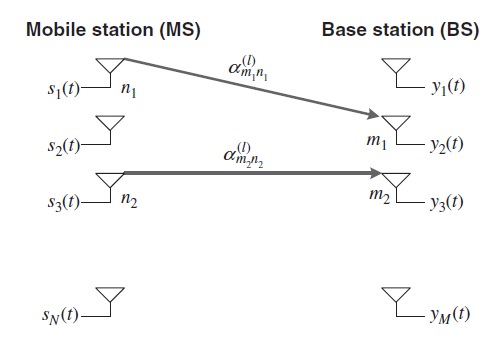
Figure 9 Correlation between Tx and Rx antennas
Q12) Explain the basic model of MIMO system?
A12) In the MIMO system which employs multiple antennas in the transmitter and/or receiver, the correlation between transmit and receive antenna is an important aspect of the MIMO channel. It depends on the angle-of-arrival (AoA) of each multi-path component. Consider a SIMO channel with a uniform linear array (ULA) in which M antenna elements are equally spaced apart, with an inter-distance of d as shown in Figure. Let y(t) denote a received signal at the ith antenna element with the channel gain ai , delay ti, and angle of arrival (AoA) fi. As shown in Figure(a), the AoA is defined as the azimuth angle of incoming path with respect to the broadside of the antenna element. Note that the received signal of each path consists of the enormous number of unresolvable signals received around the mean of AoA in each antenna element. A vector of the received signals
Y(t) = [y1(t), y2(t),….yM(t)]T
In the uniform linear array (ULA) of M elements can be expressed as

Where I denote the number of paths in each antenna element and c(ɸ) is an array steering vector. The array steering vector is defined as
c(ɸ) = [c1(ɸ), c2(ɸ),….cM(ɸ)]T

f(ɸ) denotes a complex field pattern of the mth array element and l is the carrier wavelength. The received signal in Equation (3.1) can be expressed in the following integral form:

Where h(ɸ ) represents a channel as a function of ADS (Azimuth-Delay Spread). The
Instantaneous power azimuth-delay spectrum (PADS) is given as

The average PADS is defined as an expected value as

By taking an integral of PADS over delay, PAS (Power Azimuth Spectrum or Power Angular Spectrum) is obtained as

Meanwhile, AS (Azimuth Spread or Angular Spread) is defined by the central moment of PAS, that is

Where f0 is the mean AoA. Similarly, by taking an integral of PADS over AoA, PDS (Power Delay Spectrum) is obtained as

Furthermore, DS (Delay Spread) is defined as the central moment of PDS, that is,

Where t0 is an average delay spread
Once a joint PDF of AoA and delay is given by f ðf; tÞ, the marginal PDF of AoA and delay spread is respectively given as


Figure illustrates a MIMO channel model by magnifying a channel environment in Figure. It shows three resolvable paths. Each path hasMr unresolvable paths, each of which arrives centered around the mean AoA. The AoA for these unresolvable paths follow a Gaussian distribution in the microcell or macrocell environment. Furthermore, a power distribution in AoA (i.e., PAS) follows a Laplacian distribution, even though it varies with the cell environment. Note that the natures of AoA and PAS distributions are different from each other. In other words, a distribution of AoA does not take the power of each path into account, while PAS deals with a distribution of the power with respect to AoA. Finally, a distribution of the power for the resolvable paths, that is, PDS or PDP (Power Delay Profile), usually follows an exponential distribution
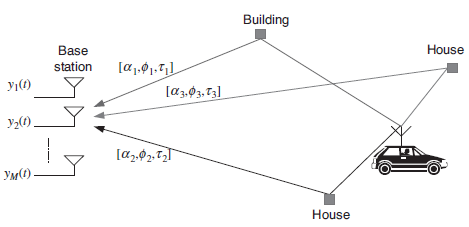
Figure 10 SIMO channel environment
Q13) Compare all the multiple access techniques?
A13)
Approach | SDMA | TDMA | FDMA | CDMA |
Idea | Segment space into cells/sectors | Segment sending time into disjoint time-slots, demand driven or fixed patters | Segment the frequency band into disjoint sub-bands | Spread the spectrum using orthogonal codes
|
Terminals | Only one terminal can be active in one cell/one sector | All terminals are active for short periods of time on the same frequency | Every terminal has its own frequency. Uninterrupted | All terminals can be active at the same place at the same moment uninterrupted. |
Signal separation | Cell structure, directed antennas | Synchronization in the time domain | Filtering in the frequency domain | Code plus special receivers |
Advantages | Very simple, increases capacity per km2 | Established, fully digital, flexible | Simple, established robust | Flexible, less frequency planning needed, soft handover |
Disadvantages | Inflexible, antennas typically fixed | Guard space needed (multipath propagation), synchronization difficult | Inflexible, frequencies are a scarce resource | Complex receivers, needs more complicated power control for senders |
Comment | Only in combination with TDMA, FDMA or CDMA useful | Standard in fixed networks, together with FDMA/SDMA used in many mobile networks | Typically combined with TDMA (frequency hopping patterns) and SDMA (frequency reuse) | Still faces some problems, higher complexity, lowered expectations : will be integrated with TDMA/FDMA |
Q14) Derive Spectral efficiency of different wireless access technologies?
A14) As we know radio frequency resource is very vital in wireless communication system. Hence RF frequencies should be maximally utilized. Following are the methods used to improve the spectrum utilization.
• Cell planning
• Frequency reuse
• Channel assignment
• Multiple access techniques
In general, spectral efficiency depends upon following parameters.
• Channel spacing in KHz
• Frequency reuse factor • cell area in Km2
• Modulation techniques
• Multiple Access techniques of types
Spectral efficiency = 
Q15) Derive Spectral efficiency in FDMA system?
A15) η = Ndata/cluster / (BWt * N * Acell )
= N * Ndata/cell / (BWt * N * Acell )channels/MHz/Km2
Where, Acell is the area of each cell
Ndata/cell = [ { (BWt - 2*Bg)/Bch } - Ncntl ]/N
BWt is total bandwidth,
Bch is channel bandwidth,
Bg is guard band bandwidth,
N is number of cells per cluster
Q16) Derive Spectral efficiency in TDMA system
A16) Spectral efficiency of Wide band TDMA and narrow band TDMA is expressed as follows:
ηWTDMA = {(Tf - Tp - Tt)/Tf} * (Ni/Ns)
Where,
Tp = preamble period,
Tt= trailer time period,
Tf= frame duration
Ns= number of symbols in a time slot, Ni = number of information bits
ηNTDMA = {(Tf - Tp - Tt)/Tf} * (Ni/Ns) * {(Nsub * Bch)/BWt}
Nsub = Number of sub bands
Nslot = Number of slots
Q17) Explain FDMA?
A17)
- It sub-divide frequency into a several frequency band with non-overlapping.
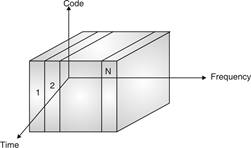
Fig. 11 FDMA
- FDMA allows user to transmit signals simultaneously to satellite transponder with the help of assigning a specific frequency to every user among a channel.
- Each transaction of signal has own unique radio channel. Channel are probably 30 KHz or less used to transmit or receive channels.
- Frequency allocation made by national policies. Uplink (i.e. from mobile station to base station). Downlink (i.e. from base station to mobile station) uses frequencies bands like. Uplink and downlink with frequencies mentioned below :
Uplink | 890.2 MHz, 915 MHz |
Downlink | 935.2 MHz to 960 MHz |
Uplink (UL) and downlink (DL) can be described with the help of one relation among them as follows:
fd = fu + 45 MHz
For Example :
If UL frequency is :
fu = 890 MHz + n∙ 0. 2 MHz
Then
fd = 935 MHz + n ∙ 0. 2 MHz
Fixed assigned frequency makes scheme very inflexible limits to no. Of sender turn into disadvantage of FDMA.