Unit-3
Statistics
Question-1: Find the arithmetic mean for the following distribution:
Class | 0-10 | 10-20 | 20-30 | 30-40 | 40-50 |
Frequency | 7 | 8 | 20 | 10 | 5 |
Solution. Let assumed mean (a) = 25
Class | Midvalue  | Frequency |  |  |
    40— 50 |      |      |      |      |
Total |
|  |
|  |
Question-2: Find the median of the following dataset-
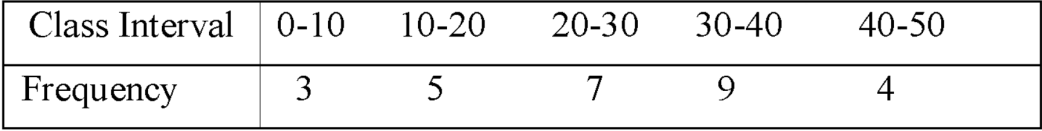
Sol.
Class interval | Frequency | Cumulative frequency |
0 - 10 | 3 | 3 |
10 – 20 | 5 | 8 |
20 – 30 | 7 | 15 |
30 – 40 | 9 | 24 |
40 – 50 | 4 | 28 |
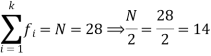
So that median class is 20-30.
Now putting the values in the formula-
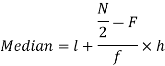
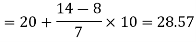
So that the median is 28.57
Question-3: Find the mode from the following data:
Age | 0-6 | 6-12 | 12-18 | 18-24 | 24-30 | 30-36 | 36-42 |
Frequency | 6 | 11 | 25 | 35 | 18 | 12 | 6 |
Solution.
Age | Frequency | Cumulative frequency |
0-6 6-12 12-18  24-30 30-36 36-42 | 6 11 25  35    12 6 | 6 17 42 77 95 107 113 |
Mode


Question-4: Find the quartile deviation of the following data-
Class interval | 0-10 | 10-20 | 20-30 | 30-40 | 40-50 |
Frequency | 3 | 5 | 7 | 9 | 4 |
Sol.
Here N/4 = 28/4 = 7 so that the 7’th observation falls in class 10 – 20.
And
3N/4 = 21, and 21’st observation falls in the interval 30 – 40 which is the third quartile.
The quartiles can be calculated as below-
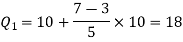
And
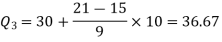
Hence the quartile deviation is-

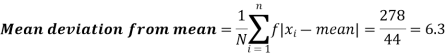
Question-5: Find the mean deviation from the mean of the following data-
Class interval | 0-6 | 6-12 | 12-18 | 18-24 | 24-30 |
Frequency | 8 | 10 | 12 | 9 | 5 |
Sol.
Class interval | Mid-value | Frequency | d = x - a | f.d | |x - 14| | f |x - 14| |
0-6 | 3 | 8 | -12 | -96 | 11 | 88 |
6-12 | 9 | 10 | -6 | -60 | 5 | 50 |
12-18 | 15 | 12 | 0 | 0 | 1 | 12 |
18-24 | 21 | 9 | 6 | 54 | 7 | 63 |
24-30 | 27 | 5 | 12 | 60 | 13 | 65 |
Total |
| 44 |
| -42 |
| 278 |

Then mean deviation from mean-
Question-6: Calculate the standard deviation of the following frequency distribution-
Weight | 60 – 62 | 63 – 65 | 66 – 68 | 69 – 71 | 72 – 74 |
item | 5 | 18 | 42 | 27 | 8 |
Sol.
Weight | Item (f) | X | d = x – 67 | f.d |  |
60 – 62 | 5 | 61 | -6 | -30 | 180 |
63 – 65 | 18 | 64 | -3 | -54 | 162 |
66 – 68 | 42 | 67 | 0 | 0 | 0 |
69 – 71 | 27 | 70 | 3 | 81 | 243 |
72 – 74 | 8 | 73 | 6 | 48 | 288 |
Total |
100 |
|
|
45 |
873 |

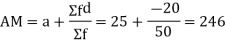
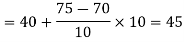
Question-7: Calculate coefficient variation for the following frequency distribution.
Wages in Rupees earned per day | 0-10 | 10-20 | 20-30 | 30-40 | 40-50 | 50-60 |
No. of Labourers | 5 | 9 | 15 | 12 | 10 | 3 |
Solution:
We already calculated

Now,
A.M 

A.M 
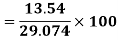
 Coefficient of Variation

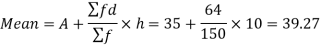
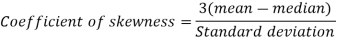
Question-8: Calculate Karl Pearson’s coefficient of skewness of marks obtained by 150 students.
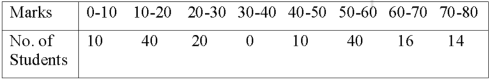
Sol. The mode is not well defined so that first we calculate mean and median-
Class | f | x | CF |  | fd |  |
0-10 | 10 | 5 | 10 | -3 | -30 | 90 |
10-20 | 40 | 15 | 50 | -2 | -80 | 160 |
20-30 | 20 | 25 | 70 | -1 | -20 | 20 |
30-40 | 0 | 35 | 70 | 0 | 0 | 0 |
40-50 | 10 | 45 | 80 | 1 | 10 | 10 |
50-60 | 40 | 55 | 120 | 2 | 80 | 160 |
60-70 | 16 | 65 | 136 | 3 | 48 | 144 |
70-80 | 14 | 75 | 150 | 4 | 56 | 244 |
Now,

And
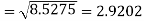
Standard deviation-
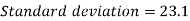
Then-

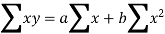
Question-9: By the method of least squats, find the straight line that best fits the following data:
 | 1 | 2 | 3 | 4 | 5 |
 | 14 | 27 | 40 | 55 | 68 |
Solution: Let the equation of the straight line best fit be  …. (1)
 |  |  |  |
1 | 14 | 14 | 1 |
2 | 27 | 54 | 4 |
3 | 40 | 120 | 9 |
4 | 55 | 220 | 16 |
5 | 68 | 340 | 25 |
 |  |  |   |
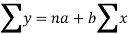
Normal equations are

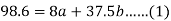
Putting the values of  in (2) and (3), we have

On solving (4) and (5), we get

On Substituting the values of a and b in (1), we get

Question-10: Fit a second-degree parabola to the following data by the least-squares method.
 | 1929 | 1930 | 1931 | 1932 | 1933 | 1934 | 1935 | 1936 | 1937 |
 | 352 | 356 | 357 | 358 | 360 | 361 | 361 | 360 | 359 |
Solution: Taking 
Taking 

The equation  is transformed into
 |  |  |  |  |  |  |  |  |
1929 | -4 | 352 | -5 | 20 | 16 | -80 | -64 | 256 |
1930 | -3 | 360 | -1 | 3 | 9 | -9 | -27 | 81 |
1931 | -2 | 357 | 0 | 0 | 4 | 0 | -8 | 16 |
1932 | -1 | 358 | 1 | -1 | 1 | 1 | -1 | 1 |
1933 | 0 | 360 | 3 | 0 | 0 | 0 | 0 | 0 |
1934 | 1 | 361 | 4 | 4 | 1 | 4 | 1 | 1 |
1935 | 2 | 361 | 4 | 8 | 4 | 16 | 8 | 16 |
1936 | 3 | 360 | 3 | 9 | 9 | 27 | 27 | 81 |
1937 | 4 | 359 | 2 | 8 | 16 | 32 | 64 | 256 |
Total |  |
|  |  |  |  |  |  |
Normal equations are


On solving these equations, we get 


Question-11: Find the correlation coefficient between age and weight of the following data-
Age | 30 | 44 | 45 | 43 | 34 | 44 |
Weight | 56 | 55 | 60 | 64 | 62 | 63 |
Sol.
X | Y |  |  |  |  | (   |
30 | 56 | -10 | 100 | -4 | 16 | 40 |
44 | 55 | 4 | 16 | -5 | 25 | -20 |
45 | 60 | 5 | 25 | 0 | 0 | 0 |
43 | 64 | 3 | 9 | 4 | 16 | 12 |
34 | 62 | -6 | 36 | 2 | 4 | -12 |
44 | 63 | 4 | 16 | 3 | 9 | 12 |
Sum= 240 |
360 |
0 |
202 |
0 |
70
|
32 |
Karl Pearson’s coefficient of correlation-
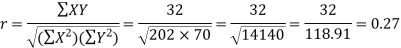
Here the correlation coefficient is 0.27.which is the positive correlation (weak positive correlation), this indicates that as age increases, the weight also increases
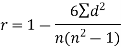
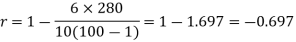
Question-12: Compute the Spearman’s rank correlation coefficient of the dataset given below-
Person | A | B | C | D | E | F | G | H | I | J |
Rank in test-1 | 9 | 10 | 6 | 5 | 7 | 2 | 4 | 8 | 1 | 3 |
Rank in test-2 | 1 | 2 | 3 | 4 | 5 | 6 | 7 | 8 | 9 | 10 |
Sol.
Person | Rank in test-1 | Rank in test-2 | d =  |  |
A | 9 | 1 | 8 | 64 |
B | 10 | 2 | 8 | 64 |
C | 6 | 3 | 3 | 9 |
D | 5 | 4 | 1 | 1 |
E | 7 | 5 | 2 | 4 |
F | 2 | 6 | -4 | 16 |
G | 4 | 7 | -3 | 9 |
H | 8 | 8 | 0 | 0 |
I | 1 | 9 | -8 | 64 |
J | 3 | 10 | -7 | 49 |
Sum |
|
|
| 280 |
Question-13: Find the regression line of y on x for the given dataset.
X | 4.3 | 4.5 | 5.9 | 5.6 | 6.1 | 5.2 | 3.8 | 2.1 |
Y | 12.6 | 12.1 | 11.6 | 11.8 | 11.4 | 11.8 | 13.2 | 14.1 |
Sol.
Let y = a + bx is the line of regression of y on x, where ‘a’ and ‘b’ are given as-

We will make the following table-
x | y | Xy |  |
4.3 | 12.6 | 54.18 | 18.49 |
4.5 | 12.1 | 54.45 | 20.25 |
5.9 | 11.6 | 68.44 | 34.81 |
5.6 | 11.8 | 66.08 | 31.36 |
6.1 | 11.4 | 69.54 | 37.21 |
5.2 | 11.8 | 61.36 | 27.04 |
3.8 | 13.2 | 50.16 | 14.44 |
2.1 | 14.1 | 29.61 | 4.41 |
Sum = 37.5 | 98.6 | 453.82 | 188.01 |
Using the above equations we get-


On solving these both equations, we get-
a = 15.49 and b = -0.675
So that the regression line is –
y = 15.49 – 0.675x
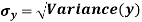
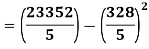
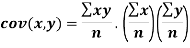
Question-14: Discuss the Reliability of Regression Estimates:
A | 45 | 38 | 59 | 64 | 72 |
B | 60 | 48 | 82 | 93 | 45 |
Solution:
For A,
 | 45 | 38 | 59 | 64 | 72 |  |
 | 2025 | 1444 | 3481 | 4096 | 5184 | 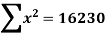 |
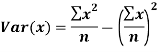


For B,
 | 60 | 48 | 82 | 93 | 45 |  |
 | 2025 | 1444 | 3481 | 4096 | 5184 |  |
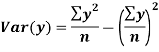


Now,
 | 45 | 38 | 59 | 64 | 72 |  |
 | 60 | 48 | 82 | 93 | 45 |  |
 | 2700 | 1824 | 4838 | 5952 | 3240 |  |


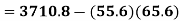
The standard error of Regression of estimates of y on x is
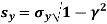
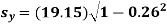
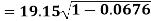

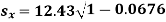 …..(Standard error of Regression of estimates of y on x is )


