Unit - 4
Design against Fluctuating Loads
Q1) Define stress concentration. State its causes.
A1) Stress Concentration
- Whenever a machine component changes the shape of its cross-section, the simple stress distribution no longer holds good and the neighborhood of the discontinuity is different.
- This is regularity is the stress distribution caused by abrupt changes of form is called stress concentration.
- It occurs for all kind of stresses in the presence of fillets, notches, holes, keyways, splines, surface roughness or scratches etc.
- Consider a member with different cross section under a tensile load as shown in figure.
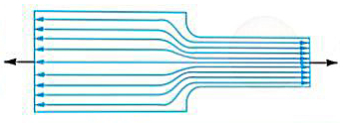
- A little consideration will show that the nominal stress in the right- and left-hand sides will be uniform but in the region where the cross section is changing, are distribution of the forces within the member must take place.
- The material near the edges is stressed considerable e higher than the average value.
- The maximum stress occurs at some point on the fillet and is directed parallel to the boundary at that point.
The causes of stress concentration are as follows
(i) Variation in properties of materials.
- In design of machine components, it is assumed that the material is homogeneous throughout the component.
- In practice, there is variation in material properties from one end to another due to following factors:
(a) Internal cracks and flaws like blow holes
(b) Cavities in welds
(c) Air holes in steel components, and
(d) Non metallic or foreign inclusions
- These variations act as discontinuities in the component and cause stress concentration.
(ii) Load application.
- Machine components are subjected to forces.
- These forces act either at a point or over a small area on the component.
- Since the area is small, the pressure at these points is excessive.
- This results in stress concentration.
- The examples of these load applications are as follows:
(a) Contact between the meshing teeth of the driving and the driver gear
(b) Contact between the cam and follower
(c) Contact between the balls and the races of ball bearing
(d) Contact between the rail and wheel
(e) Contact between the crane hook and the chain.
- In all these cases, the concentrated load is applied over a very small area resulting in stress concentration.
(iii) Abrupt changes in section.
- In order to Mount gears, sprockets, pulleys and ball bearings on a transmission shaft, steps are cut on the shaft and shoulders are provided from assembly considerations.
- Although, these features are essential, they create change of the cross section of the shaft.
- This results in stress concentration at these cross-sections.
(iv) Discontinuities in the component.
- Certain features of machine components such as oil holes or oil grooves keyways and splines, and screw threads result in discontinuities in the cross section of the component.
- There is stress concentration in the vicinity of these discontinuities.
(v) Machining scratches.
- Machining scratches stamp mark or inspection mark are surface irregularities, which cause stress concentration.
Q2) State the remedies provided to avoid stress concentration.
A2) Methods of reducing stress concentration
- The presence of stress concentration cannot be totally eliminated but it may be reduced to some extent.
- In fig. 1 (a) we see that stress lines tend to bunch up and cut very close to the sharp reentrant corner.
- In order to improve the situation, fillets may be provided, as shown in figure (b) and (c) to give more equally spaced flow lines.
- Following Figures 2 to 3 show the several ways of reducing the stress concentration in shaft and other cylindrical members with shoulders, holes and threads respectively.
- It may be noted that it is not practicable to use large radius fillets as in case of ball and roller bearing mountings. In such cases, notches may be cut as shown in figure 1 (d) and figure 2 (b) and (c).

Fig. 1

Fig 2

Fig 3

Fig 4
- The stress concentration effects of a press fit maybe reduced by making for gradual transition from the rigid to the more flexible shaft.
- The various ways of reducing stress concentration for such cases are shown in figure 4 (a), (b) and (c).
Q3) Explain fluctuating stresses.
A3)
- Consider a rotating beam of circular cross section and carrying a load W, as shown in figure.
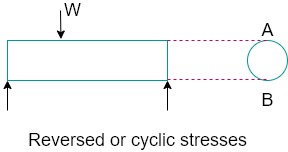
- This load induces stresses in the beam which are cyclic in nature.
- The upper fibres of the beam (at point A) are under compressive stress and the lower fibres (at point B) are under tensile stress.
- After half revolution the point B occupies the position of point A and the point A occupies the position of point B.
- Thus, the point B is now under compressive stress and point A under tensile stress. The speed of variation of these stresses depends upon the speed of the beam.
- Therefore, for each revolution of the beam, the stresses are reversed from compressive to tensile.
- The stresses which vary from one value of compressive to the same value of tensile or vice versa, are known as completely reversed or cyclic stresses.
- The stresses which vary from a minimum value to a maximum value of the same nature are called fluctuating stresses.
- The stresses which vary from 0 to a certain maximum value are called repeated stresses.
- The stresses which vary from a minimum value to a maximum value of opposite nature are called alternating stresses.
Q4) Explain fatigue failure, Endurance limit & draw S – N curve.
A4)
- It has been experimentally found that when a material is subjected to repeated stress, it fails at stresses below the yield point stresses.
- Such type of failure of a material is known as fatigue.
- The failure is caused by means of a progressive crack formation which are usually fine and of microscopic size.
- The failure may occur even without any prior indication.
- The fatigue of material is affected by the size of the component, relative magnitude of static and fluctuating loads and the number of load reversals.
- In order to study the effect of fatigue of a material, a rotating mirror beam method is used.
- In this method, a standard mirror polished specimen, as shown in Fig (a), is rotated in a fatigue testing machine while the specimen is loaded in bending.
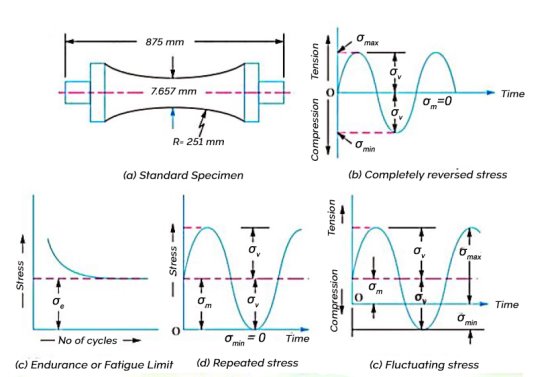
- As the specimen rotates, the bending stress at the upper fibres varies from maximum compressive to maximum tensile while the bending stress at the lower fibres varies from maximum tensile to maximum compressive.
- The specimen is subjected to a completely reversed stress cycle.
- This is represented by a time stress diagram as shown in figure (b).
- A Record is kept of the number of cycles required to produce failure at a given stress, and the results are plotted in stress cycle curve as shown in figure (c).
- A little consideration will show that if the stress is kept below a certain value as shown in by dotted line in figure (c), the material will not fail whatever may be the number of cycles.
- This maximum stress, represented by dotted line is known as endurance or fatigue limit
 .
. - It is defined as maximum value of the completely reversed bending stress which is polished standard specimen can with stand without failure, for infinite number of cycles (usually
 cycles).
 - It may be noted that the term endurance limit is used for reverse bending only while for other types of loading, the term endurance strength may be used when referring the fatigue strength of the material.
- It may be defined as the safe maximum stress which can be applied to the machine part working under actual conditions.
- We have seen that when a machine member is subjected to a completely reversed stress, the maximum stress in tension is equal to the maximum stress in compression as shown in figure (b). In actual practice, many machine members undergo different range of stress then the completely reversed stress.
- The stress versus time diagram for fluctuating stress having values
 is shown in figure (c).
 - The variables test, in general, may be considered as a combination of study (or mean or average) stress and a completely reversed stress component
 .
. - The following relations are derived from figure 6.2 (c).
- Mean or average stress

2. Reversed stress component or alternating or variable stress

3. For repeated loading, the stress varies from maximum to zero each cycle as shown in figure (d).

4. Stress ratio,  For completely reversed stresses, R = -1 and for repeated stresses, R = 0. It may be noted that R cannot be greater than unity.
5. The following relation between endurance limit and stress ratio may be used.
Q5) Explain notch sensitivity.
A5)
- In cyclic loading, the effect of the notch on the fillet is usually less than predicted by the use of the theoretical factors as discussed before.
- The difference depends upon the stress gradient in the region of the stress concentration and on the hardness of the material.
- The term notch sensitivity is applied to this behavior.
- It may be defined as the degree to which the theoretical effect of stress concentration is actually reached.
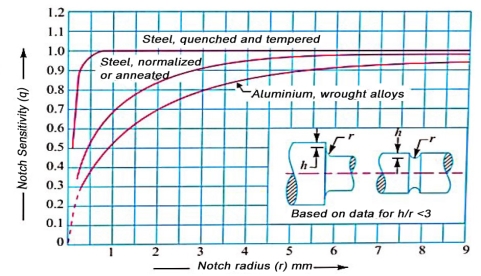
- The stress gradient depends mainly on the radius of the notch, hole or fillet and on the grain size of the material.
- Since the extensive data for estimating the notch sensitivity factor (q) is not available.
- Therefore, the curves, as shown in figure, may be used for determining the factors of q for two steels.
- When the notch sensitivity factor q is used in cyclic loading, then fatigue stress concentration factor may be obtained from the following relations:


Where,  theoretical stress concentration factor for axial or bending loading, and
 theoretical stress concentration factor for torsional or shear loading.
Q6) What are the endurance strength modifying factors?
A6)
- The endurance limit
 of a material as determined by the rotating beam method is for reverse bending load.
 - There are many machine members which are subjected to loads other than reverse bending loads.
- Thus, the endurance limit will also be different for different types of loading.
- The endurance limit depending upon the type of loading may be modified as discussed below:
Let,  = load concentration factor for the reversed or rotating bending load. Its value is usually taken as unity.
 = load correction factor for the reversed axial load. Its value may be taken as 0.8.
 = Load correction factor for the reversed torsional or shear load. Its value may be taken as 0.55 for ductile materials and 0.8 for brittle materials.
- Therefore, endurance limit for reversed bending load,

Endurance limit or reversed axial load,
And endurance limit for reversed torsional shear load,
Q7) Explain design for finite & infinite life.
A7)
- There are two types of problems in fatigue design:
(i) Components subjected to completely reversed stresses, and
(ii) Components subjected to fluctuating stresses
- As shown in figure, the mean stress is zero in case of completely reversed stresses.
- The stress distribution consists of tensile stresses for the first half cycle and compressive stresses for the remaining half cycle and stress cycle passes through zero.
- In case of fluctuating stresses, there is always a mean stress, and the stresses can be purely tensile, purely compressible or mixed depending upon the magnitude of the mean stress.
- Such problems are solved with the help of modified Goodman diagram.
- The design problems for completely reversed stresses are further divided into two groups
(i) Design for infinite life, and
(ii) Design for finite life
Case I:
- When the component is to be designed for finite life, the endurance limit becomes the criterion of failure.
- The amplitude stress induced in such components should be lower than the endurance limit in order to withstand the infinite number of cycles.
- Such components are designed with the help of the following equations


Where  are stress amplitudes in the components and
  are corrected endurance limits in reverse bending and torsion respectively.
Case II:
- When the component is to be designed for finite life, the SN Cove as shown in figure can be used.
- The curve is valid for steels.
- It consists of a straight-line AB drawn from (0.9
 at
at  cycles to
  cycles on a log – log paper.
 - The design procedure for such problems is as follows:
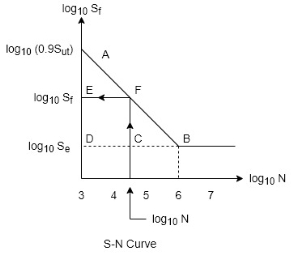
(i) Locate point A with coordinates
 since
since 
(ii) Locate point B with coordinates

(iii) Join  , which is used as a criterion of failure for finite life problems.
(iv) Depending upon the life N of the component, draw a vertical line passing through  the abscissa. This line intersects AB at point F.
(v) Draw a line  parallel to the abscissa. The ordinate at point E, i.e.,
  the fatigue strength corresponding to N cycles.
The value of fatigue strength  obtained by the above procedure is used for the design calculations.
Q8) Explain cumulative damage in fatigue failure.
A8)
- In certain applications, the mechanical components are subjected to different stress levels for different parts of the work cycle.
- The life of such component is determined by the Miner’s equation.
- Suppose that a component is subjected to completely reversed stresses
 for
for  cycles,
 for
for  cycles and so on.
 - Let
 be the number of stress cycles before fatigue failure, if only the alternating stress
  is acting.
 - One stress cycle will consume
 of the fatigue life and since there are
  such cycles at stress level, the proportionate damage of fatigue life will be
- Similarly, the proportionate damages stress level
 will be
- Adding these quantities, we get

- The above equation is known as Miner's equation.
- Sometimes, the number of cycles
 stress levels
  are unknown.
 - Suppose that
 are proportions of the total life that will be consumed by the stress level
  etc.
etc. - Let N be the total life of component. Then,

Substituting these values in Miner's equation,


With the help of above equations, the life of the component subjected to different stress levels can be determined.
Q9) Explain procedure to draw Soderberg & Goodman line.
A9)
- When a component is subjected to fluctuating stresses as shown in figure (a), there is mean stress
 as well as stress amplitude
  .
. - It has been observed that mean stress component has effect on fatigue failure when it is present in combination with alternating component.
- The fatigue diagram for the general case is shown in figure.
- In this diagram the mean stress is plotted on the abscissa.
- The stress amplitude is plotted on the ordinate.
- The magnitude of
 depends upon the magnitude of maximum and minimum force acting on the component.
 - When stress amplitude
 is zero, the load is purely static and the criterion of failure is
  .
. - These limits are plotted on the abscissa. When the mean stress
 is zero, the stress is completely reversing in the criterion of failure is endurance limit
  that is plotted on the ordinate.
 - When the component is subjected to both components of stress
 the actual failure occurs at different scattered points shown in the figure.
 - There exists a border, which divides safe region from unsafe reason for various combinations of
 .
. - Different criterions are proposed to construct the border line dividing safe zone and failure zone.
- They include Gerber line, Soderberg line and Goodman line.
- Gerber Line: A parabolic of joining
 on the ordinate to
  on the abscissa is called the Gerber line.
 - Soderberg Line: A straight line joining
 on the ordinate to
  on the abscissa is called the Soderberg line.
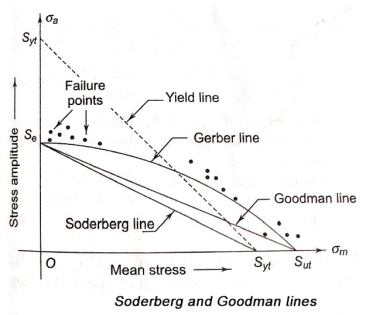
Goodman line: A straight line joining  on the ordinate to
  on the abscissa is called the Goodman line.
- The Gerber parabola fits the failure points of test data in the best possible way.
- Goodman line fits beneath the scatter of this data.
- Both Gerber parabola and Goodman line intersect at
 on the ordinate to
  on the abscissa.
 - However, the Goodman line is more safe from design considerations because it is completely inside the Gerber parabola and inside the failure points.
- The Soderberg line is more conservative failure criterion and there is no need to consider even yielding in this case.
- A Yield line is constructed connecting
 on both axes.
 - It is said as limit on first cycle of stress.
- This is because if a part yields, it has failed, regardless of its safety in fatigue.
- We will apply following form for the equation of straight line,

Where a and b are the intercepts of the line on X and Y axes respectively.
Applying above formula, the equation of Soderberg line is given by

Similarly, the equation of Goodman line is given by

Goodman line is widely used as the criterion of failure when the component is subjected to mean stress as well as stress amplitude. It is because of the following reasons:
(i) Goodman line is safe from design consideration because it is completely inside the failure points of test data.
(ii) Equation of straight line is simple compared with equation of parabolic curve.
(iii) It is not necessary to construct scale diagram and rough sketch is enough to construct fatigue diagram.
Q10) Explain procedure to draw Gerber curve
A10)
- The Soderberg line and Goodman line illustrated in Fig are straight lines.
- The theories using such straight lines for predicting fatigue failure are called linear theories.
- There are some theories that use parabolic or elliptical curves instead of straight lines.
- These theories are called non linear theories.
- One of the most popular non-linear theories is Gerber theory that is based on parabolic curve.
- The Gerber curve is shown in Fig.
- The equation for Gerber curve is as follows:

- The above equation is called Gerber equation. It can be also written in the following form,

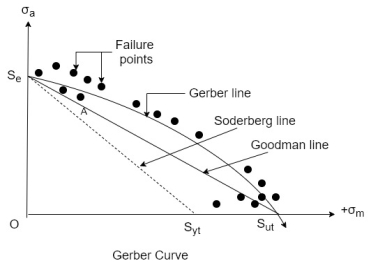
- Theories based on Soderberg line or Goodman line, as failure criteria are consecutive theories. This results in increased dimensions of the component.
- The Gerber curve takes mean path through failure points. It is therefore more accurate in predicting fatigue failure.
Q11) Explain fatigue of components under combined stresses.
A11)
- In case of two-dimensional stresses, each of the two stresses may have two components mean and alternating.
- Similarly, the bending moment as well as torsional moment may have two components mean and alternating.
- Such problems involving combination of stresses are solved by the distortion energy theory of failure.
- The most general equation of the distortion energy theory is as follows:

- Where
 are normal stresses in X, Y and Z directions and
  are shares dresses in their respective planes.
  is a stress which is equivalent to these three-dimensional stresses.
- In case of two-dimensional stresses, the component is subjected to stresses
 in X and Y directions.
Substituting  in equation (a)

- The mean and alternating components of
 respectively.
 - Similarly, the mean and alternating components of
 respectively.
 - In this analysis, the mean and alternating components are separately compiled by equation (b), i.e.


- The two stresses
 obtained by the above equations are used in the modified Goodman diagram to design the component.
 - In case of combined bending and torsional moments, there is a normal stress
 accompanied by the torsional shear stress
Substituting,  in Eq. (a),

- The mean and alternating components of
 respectively.
 - Similarly, the mean and alternating components of
 respectively.
 - Combining these components separately by equation (c),


The two stresses  obtained by the above equations are used in the modified Goodman diagram to design the component.
Q12) Explain Modified Goodman diagrams
A12)
- The components, which are subjected to fluctuating stresses, are designed by constructing the modified Goodman diagram.
- For the purpose of design, the problems are classified into two groups that are as follows
(i) Components subjected to fluctuating axial or bending stresses, and
(ii) Components subjected to fluctuating torsional shear stresses.
- Separate diagrams are used in these two cases.
- The modified Goodman diagram for fluctuating axial or bending stresses is shown in figure.
- In this diagram, Goodman line is modified by combining fatigue failure with failure by yielding.
- In this diagram, the yield strength
 is plotted on both the axes abscissa and ordinate and yield
  line is constructed to join these two points to define failure by yielding.
 - Obviously, the line
 is inclined at 45 degree to the abscissa.
 - Similarly, a line
 is constructed to join
  on the ordinate with
  on the abscissa up, which is the Goodman line.
 - The point of intersection of these two lines is B.
- The area OABC represents the region of safety for components subject to fluctuating stresses.
- The region OABC is called modified Goodman diagram.
- All the points inside the modified Goodman diagram should cause neither fatigue failure nor yielding.
- The modified Goodman diagram combines fatigue criteria as represented by the Goodman line and yield criteria as represented by yield line.
- Note that
 is the portion of Goodman line and
  is portion of yield line.
 - If the main component of stresses
 very large and alternating component
  is very small, their combination will define a point in the region BCF that would be safely within Goodman line but would be yield on the first cycle.
 - This will result in failure irrespective of safety in fatigue failure.
- The portion
 of Goodman line is vulnerable portion and needs correction. This is the reason to modify the Goodman line.
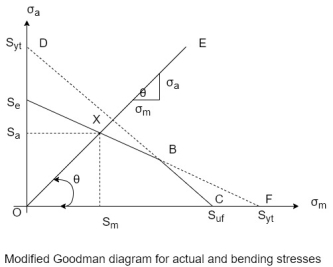
- While solving a problem, a line
 with slope of
  is constructed in such a way that,


- The magnitudes of
 can be determined from maximum and minimum force acting on the component.
Similarly, it can be proved that

- The magnitudes of
 can be determined from maximum and minimum bending moment acting on the component.
 - The point of intersection of lines
 is X.
is X. - The point X indicates the dividing line between the safe region and the region of failure.
- The coordinates of point X
 represent the limiting values of stresses, which are used to calculate the dimensions of the component.
 - The permissible stresses are as follows

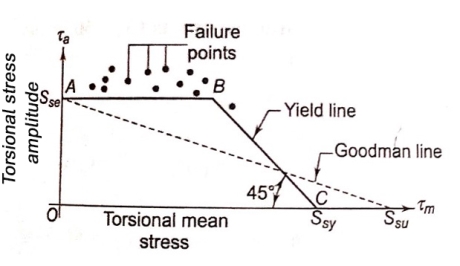
- The modified Goodman diagram for fluctuating torsional shear stresses is shown in figure.
- In this diagram, tensional means stress is plotted on abscissa while the tensional shear stress amplitude on ordinate.
- The tensional yield strength
 is plotted on abscissa and the yield line is constructed, which is inclined at 45 degree to the abscissa.
 - It is interesting to note that, up to a certain point, the torsional mean stress has no effect on tensional endurance limit.
- Therefore, a line is drawn through
 on the ordinate and parallel to the abscissa.
 - The point of intersection of this line and yield line is B.
- The area OABC represents the region of safety in this case.
- It is not necessary to construct fatigue diagram for fluctuating torsional shear stresses because
 is parallel to X axis.
 - Instead, a fatigue failure is indicated if,

And static failure is indicated if,

The permissible stresses are as follows:


Q13) Find the maximum stress induced in the following cases taking stress concentration into account:
1. A rectangular plate 60 mm × 10 mm with a hole 12 diameter as shown in Fig. (a) and subjected to a tensile load of 12 kN.
2. A stepped shaft as shown in Fig. 6.13 (b) and carrying a tensile load of 12 kN.

A13)
Case 1:
Given b=60 mm; t=10 mm; d=12 mm; w=12 kN=12×1
We know that cross-sectional area of the plate

 Nominal stress
Ratio of diameter of hole to width of plate,

From Table, we find that for d/b =0.2, theoretical stress concentration factor
Maximum stress
Case 2: Given 
We know that cross-sectional area of the plate,

∴ Nominal stress
Ratio of maximum diameter to minimum diameter,

Ratio of radius of fillet to minimum diameter

From Table 6.3 we find that for  and
and  , theoretical stress concentration factor,
Maximum stress
Q14) 120 mm wide uniform plate for continuous safe operation is used. Tensile load max = 250 KN & Min value of 100 KN.
Endurance limit stress = 225 Mpa
Yield point stress = 300 Mpa
Fos = 1.5
Then thickness =?
A14)
 120 mm


FOS=1.5
Let assume the thickness of plate=t mm
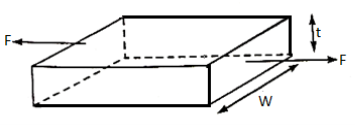


According to Soderberg line equation,


Q15) Machine subjected to fluctuating stress varying bn 40 to 10 N/mm^2. Corrected endurance limit is 270 N/mm2. Sut & Syt are 600 & 450 Mpa respectively. Determine FOS by 3 failure theories.
A15)


According to Soderberg equation,


(b) According to Goodman equation,


(c)According to Gerber equation,


Let 


Q16) A bar of Sut = 630 N/mm2 subjected to completely reversed bending stress. Corrected endurance limit is 315 Mpa. Then fatigue strength for a life of 9000 Cycles is?
A16)
386 N/mm^2


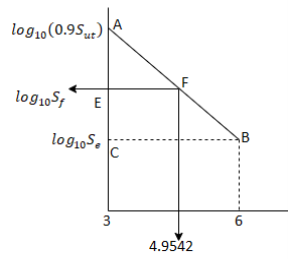


In similar ABC and AEF


On solving we get


Fatigue strength at 90000 cycle is 386,63 N/m
Q17) A machine component is subjected to a flexural stress which fluctuates between + 300 MN/m2 and – 150 MN/m2. Determine the value of minimum ultimate strength according to 1. Gerber relation; 2. Modified Goodman relation; and 3. Soderberg relation.
Take yield strength = 0.55 Ultimate strength; Endurance strength = 0.5 Ultimate strength; and factor of safety = 2.
A17)
Given 
Let  Minimum ultimate strength in
We know that het mean or avergae stress,


1. According Gerber relation
We know that according Gerber relation


2. According to modified Goodman relation
We know that according to modified Goodman relation


3. According to Soderberg relation
We know that according to Soderberg relation


Q18) A bar of circular cross-section is subjected to alternating tensile forces varying from a minimum of 200 kN to a maximum of 500 kN. It is to be manufactured of a material with an ultimate tensile strength of 900 MPa and an endurance limit of 700 MPa. Determine the diameter of bar using safety factors of 3.5 related to ultimate tensile strength and 4 related to endurance limit and a stress concentration factor of 1.65 for fatigue load. Use Goodman straight line as basis for design.
A18)
Given 
Let d=Diameter of bar in mm
 Area
Area 
We know that mean average force,

Mean stress, 
Variable force 
Variable stress 
We know that according to Goodman’s formula


Q19) Determine the thickness of a 120 mm wide uniform plate for safe continuous operation if the plate is to be subjected to a tensile load that has a maximum value of 250 kN and a minimum value of 100 kN. The properties of the plate material are as follows:
Endurance limit stress = 225 MPa, and Yield point stress = 300 MPa. The factor of safety based on yield point may be taken as 1.5.
A19)
Given: b = 120 mm; Wmax = 250 kN; Wmin = 100 kN; σe = 225 MPa = 225 N/mm2; = 300 MPa = 300 N/mm2; F.S. = 1.5
Let  Thickness of the plate in mm.
 Area
Area
We know that mean or average load,

Mean stress, 
Variable load 
Variable stress 
According to Soderberg’s formula


Q20) Determine the diameter of a circular rod made of ductile material with a fatigue strength (complete stress reversal), σe = 265 MPa and a tensile yield strength of 350 MPa. The member is subjected to a varying axial load from Wmin = – 300 × 103 N to Wmax = 700 × 103 N and has a stress concentration factor = 1.8. Use factor of safety as 2.0.
A20)
Given: σe = 265 MPa = 265 N/mm2; σy = 350 MPa = 350 N/mm2; Wmin = – 300 × 103 N; Wmax = 700 × 103 N; Kf = 1.8; F.S. = 2
Let  Diameter of the circular rod in mm.
 Area
Area 
We know that the mean or average load,

 Mean stress
Q21) A steel rod is subjected to a reversed axial load of 180 kN. Find the diameter of the rod for a factor of safety of 2. Neglect column action. The material has an ultimate tensile strength of 1070 MPa and yield strength of 910 MPa. The endurance limit in reversed bending may be assumed to be one-half of the ultimate tensile strength. Other correction factors may be taken as follows:
For axial loading = 0.7; For machined surface = 0.8; For size = 0.85; For stress concentration = 1.0.
A21)
Given: Wmax = 180 kN; Wmin = – 180 kN; F.S. = 2; σu = 1070 MPa = 1070 N/mm2; σy = 910 MPa = 910 N/mm2; σe = 0.5 σu; Ka = 0.7; Ksur = 0.8; Ksz = 0.85; Kf = 1
Let  Diameter of the rod in mm
∴ Area, A
We know that the mean or average load,

∴ Mean stress 
Variable load, 
 Variable stress
Endurance limit in reversed axial loading


We know that according to Soderberg’s formula for reversed axial loading.


