Unit 3
Raster Scan Graphics
Q1) Explain Bresenham’s Line Drawing Algorithm with example?
A1)
It is another line generation algorithm known as incremental scan conversion algorithm.
It uses only integer calculations.
Following are steps to perform bresenham’s algorithm.
Step 1: Get the input (X1,Y1) and (X2,Y2)
Step 2:find decision parameter Pk and P0
Pk=2 ∆Y - ∆X
Where ∆X=X2-X1 and ∆Y=Y2-Y1
Step 3: according to the value of Pk we need to decide the case which gives the next point of line.
Following are three cases are used to solve the bresenham’s algorithm.
Case 1: Pk>0, Pk+1=Pk + 2 ∆Y - 2 ∆X
Where Xn=X1+1 and Yn=Y1+1
Case 2: Pk<0, Pk+1=Pk + 2 ∆Y
Where Xn=X1+1 and Yn=Y1+1
Step 4: the process continues till we get the input point(X2, Y2). Then the line generates with the help of coordinates that we occur.
Example:
Step 1: Get the input (X1,Y1) and (X2,Y2)
(X1,Y1)=(20,10) and (X2,Y2)=(30,18)
Step 2: find decision parameter Pk and P0
Pk=2 ∆Y - ∆X
Where ∆X=X2-X1=30-20=10 and ∆Y=Y2-Y1=18-10=8
Hence, Pk=2 ∆Y - ∆X = 2*8-10= 16-10=6
Pk | Xn | Yn |
>0 | 21 | 11 |
2>0 | 22 | 12 |
-2<0 | 23 | 12 |
14>0 | 24 | 13 |
10>0 | 25 | 14 |
6>0 | 26 | 15 |
2>0 | 27 | 16 |
-2<0 | 28 | 16 |
14>0 | 29 | 17 |
10>0 | 30 | 18 |
At last we get the last point (X2, Y2)=(30,18) we stop.
Q2) Explain Bresenham’s Circle Drawing Algorithm with example?
A2)
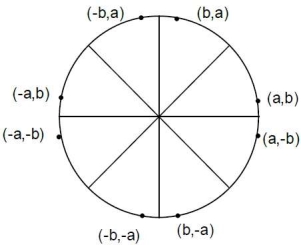
Following circle shows the 8 portions from which we will occur the coordinates of circle.
Algorithm:
Step 1: input of circle radius r, (Xc,Yc)
Step 2: initial value X=0 and Y=r
Step 3: plot pixel (X+Xc,Y+Yc)
Step 4: decision parameter Pk=3-2r
Step 5: start of loop
If Case 1:
If Pk<0 then Pk+1=Pk+4X+6
Where Xn=X+1 and Yn=Y
Else Case 2:
If Pk>0 then Pk+1=Pk+4(X-Y)+10
Xn=X+1 and Yn=Y-1
Step 6: X=Y stop
Example:
Given R=10
Hence Y=R
If we want to draw circle in center then we have given the center points as (Xc,Yc)=(2,2)
Decision parameters are Pk and P0.
P0=3-2r
Here, P0=3-2*10=3-20=-17
Hence Pk=P0= -17
Following are two cases that will be decided according to Pk’s value.
Case 1:
If Pk<0 then Pk+1=Pk+4X+6
Where Xn=X+1 and Yn=Y
Case 2:
If Pk>0 then Pk+1=Pk+4(X-Y)+10
Xn=X+1 and Yn=Y-1
Pk | Xn | Yn |
-17<0 | 0 | 10 |
-17+4*1+6=-7<0 | 1 | 10 |
-7+4*2+6=7>0 | 2 | 10 |
7+4*(3-9)+10=-7<0 | 3 | 9 |
-7+4*4+6=15>0 | 4 | 9 |
15+4*5-4*8+10=-7<0 | 5 | 8 |
-7+4*6+6=23>0 | 6 | 8 |
| 7 | 7 |
Here X=Y then stop
Q3) What are Scan Conversion Techniques in graphics?
A3)
The process of representing graphics object as a collection of pixel is the scan conversion technique.
The object of graphics are continuous.
The pixel used in scan conversion are discrete.
Each pixel having on or off state.
Real Time Method
This method is applicable for analog video.
The conversion is used for large number of delay cells only.
This method also uses the scan converter as vacuum tube.
The data is visible on raster scan display.
Frame Buffer
The picture stored in a line or frame buffer with n1 speed.
The data rate of reading is the n2 speed.
The buffer technique is used when several images are processing in memory.
The method includes interpolation from simple to smart high order comparison.
He motion detection and it is useful to improve the picture quality.
It prevents the conversion artifacts.
Q4) Explain Scan Converting Polygon techniques?
A4)
Polygon is an ordered list of vertices that are connected by edges.
For filling the polygon we need to check pixel falling on the boundary of the polygon or inside-outside of the polygon.
Following are the polygon filling algorithms:
Q5) Explain Edge Fill Algorithm as Scan Converting Polygon techniques in graphics?
A5)
The method is also known as scan line filling algorithm.
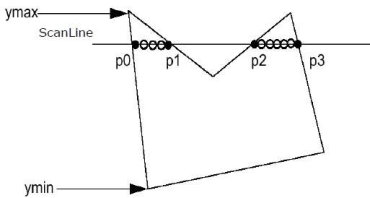
Scan line is the line which intersects the polygon.
This algorithm works by intersecting scan line with polygon edges.
This fills the polygon between the pairs of intersection.
Following are some steps to perform scan line algorithm:
Step 1: find out the Ymin and Ymax from given polygon.
Step 2: the scan line should be intersects all the edges between Ymin to Ymax. Name the intersection points of the polygon.
Step 3: sort the points of intersection according to X coordinate.
Step 4: the points that are inside the polygon fill it and ignore other points.
Following figure shows the scan line algorithm:
Q6) Explain Seed Fill Algorithm as Scan Converting Polygon techniques in graphics?
A6)
The seed fill algorithm is works with picking a point inside an object.
The process starts with filling the pixels until it hits the boundary,
As it gets the color of boundary different than the fill color, the algorithm completed.
This algorithm is also known as boundary fill and flood fill algorithm.
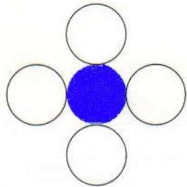
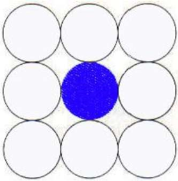
The algorithm works on 4 connected or 8 connected pixels.
In this algorithm, the color of boundary is assume same for entire object.
Following figure shows the 4 connected and 8 connected boundary fill algorithm.
Q7) Explain Antialiasing in short?
A7)
The technique of antialiasing is used to diminish the jaggies.
Jaggies are the stair step lines on the edges and object that should be smooth.
The defects that are occurs when high resolution images are presented in lower resolution reduces by antialiasing in digital imaging.
The antialiasing technique makes the curved or slanting lines smoother by adding slight discoloration to the edges of the object or line.
The antialiasing causes the edges to blur and melt together.
As the human eye can no longer notice the slight discoloration that antialiasing creates when the image is zoom.
Antialiasing removes jagged edges by adding subtle color changes around the lines.
The slight changes in color around the edges of an image helps the line blend around curves.
Q8) Explain Halftoning in short?
A8)
It is reprographic shading technique.
It is used to simulate continues tone imagery through dots.
The dots varies in the size or in spacing.
Hence the dots represents the gradient like effect.
Halftone is used to refer the image that is produced by this process.
The range of color in continuous tone goes to infinite or in the range of gray.
It reduces the visual reproduction of the image.
The image that is reducing can be printed with only one color of ink or dot can be differs in size or spacing.
The reproduction relies on the optical illusion.
The halftone dots are so small that human eyes interprets it the patterned areas if they were smooth tones.
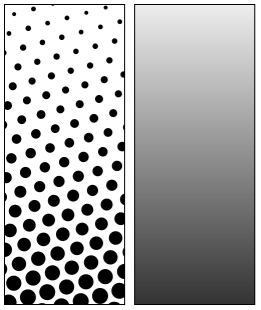
Following is the halftone dots and human eye interpretation.
