UNIT 3
Software Design
Q1) Give short notes on Data coupling, Stamp coupling, Control coupling Common coupling, Content coupling?
A1)
a) Data coupling
The dependency between module A and B is said to be data coupled if their dependency is based on the fact they communicate by only passing of data. Other than communicating through data, the two modules are independent
b) Stamp coupling
Stamp coupling occurs between module A and B when complete data structure is passed from one module to another.
c) Control coupling
Module A and B are said to be control coupled if they communicate by passing of control information. This is usually accomplished by means of flags that are set by one module and reacted upon by the dependent module.
d) Common coupling
With common coupling, module A and module B have shared data. Global data areas are commonly found in programming languages. Making a change to the common data means tracing back to all the modules which access that data to evaluate the effect of changes.
e) Content coupling
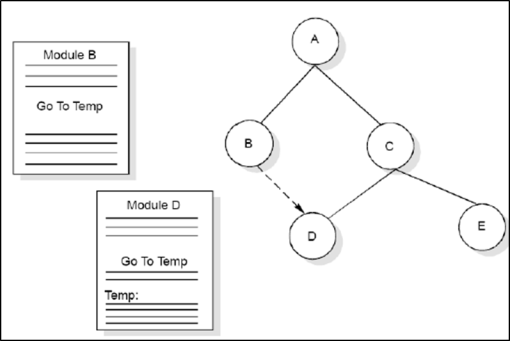
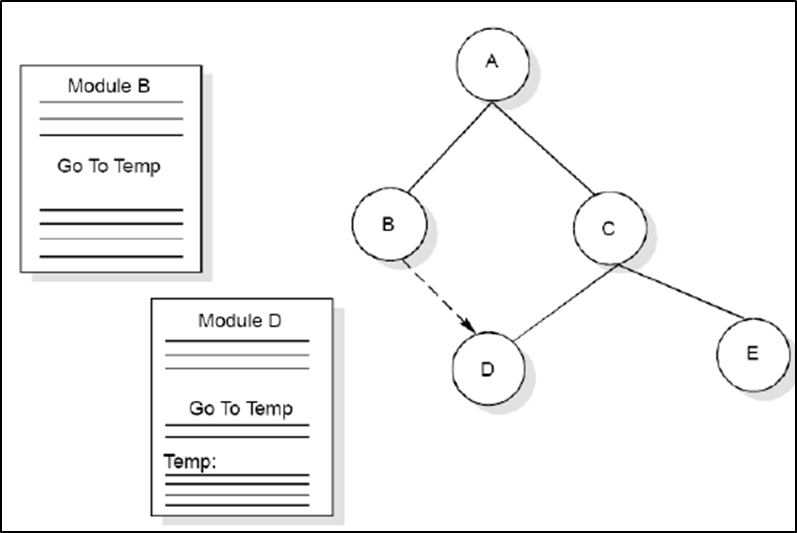
Content coupling occurs when module A changes data of module B or when control is passed from one module to the middle of another. In fig. module B branches into D, even though D is supposed to be under the control of C.

Q2) Explain Cohesion and its types?
A2)
It is a measure of the degree to which the elements of a module are functionally related
Types of cohesion

Functional cohesion:
A and B are part of a single functional task. This is very good reason for them to be contained in the same procedure.
Sequential Cohesion
Module A outputs some data which forms the input to B. This is the reason for them to be contained in the same procedure.
Procedural Cohesion
Temporal Cohesion
Logical Cohesion
Logical cohesion occurs in modules that contain instructions that appear to be related because they fall into the same logical class of functions.
Coincidental Cohesion
Coincidental cohesion exists in modules that contain instructions that have little or no relationship to one another.
Relationship between Cohesion & Coupling
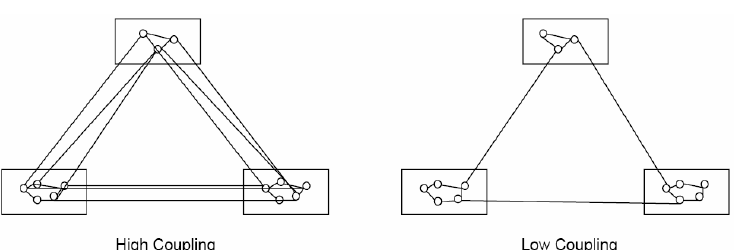
Fig.View of cohesion and coupling
If the software is not properly modularized, a host of seemingly trivial or changes will result into death of the project Therefore, a software engineer must design the modules with goal of high cohesion and low coupling
Q3) What is data modelling?
A3)
Data modelling is the act of exploring data-oriented structures. Like other modellingartifacts data models can be used for a variety of purposes, from high-level conceptual models to physical data models. From the point of view of an object-oriented developer, data modelling is conceptually similar to class modeling. With data modeling you identify entity types whereas with class modeling you identify classes. Data attributes are assigned to entity types just as you would assign attributes and operations to classes. Examples for data modeling include:
• Entity-Relationship diagrams
• Entity-Definition reports
• Entity and attributes report
• Table definition report
• Relationships, inheritance, composition and aggregation.
Q4) What is a modularity?
A4)
Modularity is a software design and architecture pattern achieved by dividing the software into uniquely named and addressable components, which are also known as modules. The basic idea underlying modular design is to organizea complex system (large program) into a set of distinct components, which are developed
Independently and then are connected together. This may appear as a simple idea however, the effectiveness of the technique depends critically on the manner in which the systems are divided into components and the mechanisms used to connect components together. Modularising a design helps to plan the development in a more effective manner, accommodate changes easily, conduct testing and debugging effectively and efficiently, and conduct maintenance work without adversely affecting the functioning of the software. Figure shows modularity.

Q5) Elaborate Object oriented design?
A5)
Object oriented design is the result of focusing attention not on the function performed by the program, but instead on the data that are to do manipulated by the program Thus, it is orthogonal to function oriented design. It starts with an examination of the real world “things” that are part of the problem to be solved These things (which we will call objects) are characterized individually in terms of their attributes and behaviour.
Basic Concepts on which Objects are based:
Q6) What is the importance of Structured Analysis?
A6)
Structured Analysis is a data analysis and development tool that allows the analyst to understand the system and its functional activities in a detailed logical manner. It is a systematic approach, using graphical tools that analyse and summarize objectives of an existing system to develop new system specification which are easy to decipher by users.
The properties of structured analysis are:
Structured Analysis Tools
Q7) What is Structured Analysis? How it represented?
A7)
Structured analysis is a top-down approach, which focuses on refining the problem withthe help of functions performed in the problem domain and data produced by these functions.
The basic principles of this approach are:
Generally, structured analysis is represented using data flow diagram.
IEEE defines data flow diagram (also known as bubble chart or work flow diagram) as “a diagram that depicts data sources, data sinks, datastorage, and processes performed on data as nodes, and logical flow of data as linksbetween the nodes”.
DFD comprises of four basic notations (symbols), which help to depict information in a system. These notations are listed in Table.

Q8) What is the major difference between structured English and Pseudo Code?
A8)
Structured English is native English language. It is used to write the structure of a program module. It uses programming language keywords. On the other hand, Pseudo Code is more like to the programming language without syntax of any specific language.
Q9) What are Software Design Approaches?
A9)
Two generic approaches for software designing:
Top Down Design
Top-down design takes the whole software system as one entity and then decomposes it to achieve more than one sub-system or component based on some characteristics. Each sub-system or component is then treated as a system and decomposed further. This process keeps on running until the lowest level of system in the top-down hierarchy is achieved. Top-down design starts with a generalized model of system and keeps on defining the more specific part of it. When all components are composed the whole system comes into existence.
Top-down design is more suitable when the software solution needs to be designed from scratch and specific details are unknown.
Bottom-up Design
The bottom up design model starts with most specific and basic components. It proceeds with composing higher level of components by using basic or lower level components. It keeps creating higher level components until the desired system is not evolved as one single component. With each higher level, the amount of abstraction is increased. This strategy is more suitable when a system needs to be created from some existing system, where the basic primitives can be used in the newer system.Both, top-down and bottom-up approaches are not practical individually.
Q10) Elaborate Structured Analysis and Structured Design?
A10)
Structured Analysis and Structured Design (SA/SD) is diagrammatic notation which is design to help people understand the system. The basic goal of SA/SD is to improve quality and reduce the risk of System failure. It establishes concrete management specification and documentation. It focuses on solidity, pliability and maintainability of system.Basically the approach of SA/SD is based on the Data Flow Diagram. It is easy to understand SA/SD but it focuses on well defined system boundary whereas JSD approach is too complex and does not have any graphical representation.
SA/SD is combined known as SAD and it mainly focuses on following 3 points:
SA/SD involves 2 phases:
Analysis Phase: It uses Data Flow Diagram, Data Dictionary, State Transition diagram and ER diagram.
Design Phase: It uses Structure Chart and Pseudo Code.
1. Analysis Phase:
Analysis Phase involves data flow diagram, data dictionary, state transition diagram and entity relationship diagram.
Data Flow Diagram:
In the data flow diagram model describe how the data flows through the system. We can incorporate the Boolean operators and & or to link data flows when more than one data flow may be input or output from a process.
For example, if we have to choose between two paths of a process we can add an operator or and if two data flows are necessary for a process we can add and operator. The input of the process “check-order” needs the credit information and order information whereas the output of the process would be a cash-order or a good-credit-order.
Data Dictionary:
The content that are not described in the DFD are described in data dictionary. It defines the data store and relevant meaning. A physical data dictionary for data elements which flow between processes, between entities, and between processes and entities may be included. This would also include descriptions of data elements that flow external to the data stores.
A logical data dictionary may also be included for each such data element. All system names, whether they are names of entities, types, relations, attributes or services, should be entered in the dictionary.
State Transition Diagram:
State transition diagram is similar to dynamic model. It specifies how much time function will take to execute and data access triggered by events. It also describes all of the states that an object can have, the events under which an object changes state, the conditions that must be fulfilled before the transition will occur and the activities undertaken during the life of an object.
ER Diagram:
ER diagram specifies the relationship between data store. It is basically used in database design. It basically describes the relationship between different entities.
2. Design Phase:
Design Phase involves structure chart and pseudo code.
Structure Chart:
It is created by the data flow diagram. Structure Chart specifies how DFS’s processes are grouped into task and allocate to CPU.The structured chart does not show the working and internal structure of the processes or modules, and does not show the relationship between data or data-flows. Similar to other SASD tools, it is time and cost independent and there is no error-checking technique associated with this tool.
The modules of a structured chart are arranged arbitrarily and any process from a DFD can be chosen as the central transform depending on the analysts’ own perception. The structured chart is difficult to amend, verify, maintain, and check for completeness and consistency.
Pseudo Code:
It is actual implementation of system.It is a informal way of programming which doesn’t require any specific programming language or technology.