Unit - 1
Introduction To Economics
Q1) What is decision making in Economics?
A1) Economic decision making is the process of making business decisions involving money. The purpose of making these decisions is generally to come up with strategies that help to either make the company more valuable or to increase the owner's revenue. Those involved in the decision-making process must have access to the company's detailed financial reports and must have a good understanding of the company's economic climate.
Success in the world of business depends on a company's leader ability to make wise economic decisions. Since economic decisions have to do with the amount of money a business earns or is valued at, it is essential that the decision-making process relies heavily on the company's financial reports. The outcome of the decisions being made should involve some type of monetary reward, and the decision-makers generally expect the reward to be much greater than the cost or sacrifice that's required to obtain it.
Financial decisions that benefit an organization often involve spending money. This money is often used to expand marketing strategies, recruit talent, increase production, improve product quality, and more. Financial decisions can also include the dismissal of an employee, the discontinuation of a particular product, the sale of a drink from a business, or the acquisition of a loan from a financial institution.
Q2) What do you mean by Engineering Economics?
A2) Engineering is the profession of applying mathematical and natural science knowledge gained through research experience and practice to judgments to develop ways to economically utilize natural materials and powers for the benefit of mankind.
Engineering economics is a very important theme for engineers. This subject helps to understand the need for knowledge of economics to become an effective manager and decision maker. The Economics theories are used to take decisions related to uncertain and changing business environment. Engineering economics quantifies the benefits and costs associated with engineering projects to determine if they can save enough money to justify capital investment. Engineering economics needs to apply the principles of engineering design and analysis in order to provide products and services that satisfy consumers at an affordable cost.
Q3) What are the features of Engineering Economics?
A3)
1. Engineering economics is closely linked to traditional microeconomics.
2. Engineering Economics is dedicated to problem solving and decision making at the operational level.
3. Engineering economics can lead to sub-optimization of the conditions under which a solution achieves tactical goals at the expense of strategic effectiveness.
4. Engineering economics helps identify alternative uses for limited resources and select preferred course of action.
5. Engineering Economics integrates economic theory with engineering practice.
Q4) What do you mean by demand analysis?
A4) Demand analysis is the process by which management makes decisions regarding production, cost allocation, advertising, inventory holding, and pricing. The amount an enterprise produces depends on its production capacity, but depends on how much it has to strive for production.
Thus, the marketer is required to analyze properly the demand for its product in the market and must hold inventory accordingly. Such as if there is a potential demand in the future, then the firm should hold more inventories and in case there is no demand, then the production remains unwarranted, and hence, lesser inventories are held.
There is a possibility that production might exceed the demand, then the marketer must use alternative ways such as better advertisements to create a new demand. The demand shows the relationship between two economic variables, the price of the product and the quantity of product that a consumer is willing to buy for a given period of time, other things being equal
Q5) What are the characteristics of Demand?
A5) The following are the main characteristics or characteristics of the demand that the marketer must take into account when analyzing the demand for his product:
Q6) Define elasticity of demand.
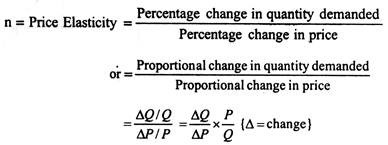
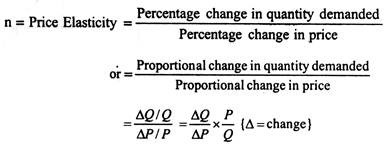
A6) Price elasticity of demand measures the degree of responsiveness of demand to changes in the price of goods. Therefore, its measurement depends on comparing the rate of change in prices with the rate of change in the resulting volume of demand.
There are slight problems with calculating the rate of change in this way. Depending on whether you move the demand curve up or down, you will get different answers. 1 way to avoid this difficulty is to take the average of 2 prices and 2 quantities in the range you are considering and compare the change in the mean, rather than comparing it with the price or quantity at the start of the change.
The formula for calculating the price elasticity of demand looks.
Q7) What do you mean by Elastic demand? Explain with the diagram.
A7) Elasticity of demand is illustrated in Figure 1. Note that a change in price results in a large change in quantity demanded. An example of products with an elastic demand is consumer durables. These are items that are purchased infrequently, like a washing machine or an automobile, and can be postponed if price rises. For example, automobile rebates have been very successful in increasing automobile sales by reducing price.
Close substitutes for a product affect the elasticity of demand. If another product can easily be substituted for your product, consumers will quickly switch to the other product if the price of your product rises or the price of the other product declines. For example, beef, pork and poultry are all meat products. The declining price of poultry in recent years has caused the consumption of poultry to increase, at the expense of beef and pork. So, products with close substitutes tend to have elastic demand.
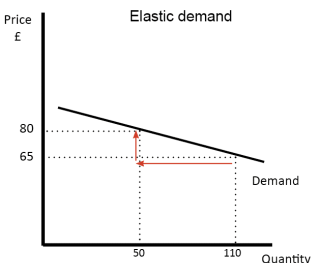
Figure: Elastic Demand
Q8) What is Unitary elastic?
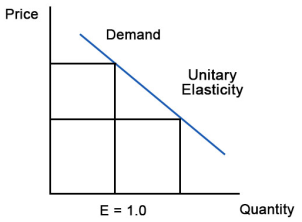
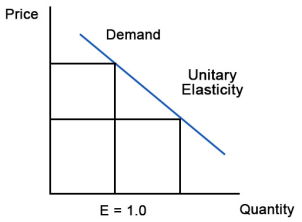
A8) If the elasticity coefficient is equal to one, demand is unitarily elastic as shown in Figure 3. For example, a 10% quantity change divided by a 10% price change is one. This means that a 1% change in quantity occurs for every 1% change in price.
Q9) What is demand forecasting?
A9) Demand forecasting is the process of estimating future customer demand for a defined period of time using historical data and other information.
Good demand forecasting gives companies valuable information about their current and other market potential, allowing managers to make informed decisions about pricing, business growth strategies, and market potential.
Q10) Why is demand forecasting important?
A10) There are a number of reasons why demand forecasting is an important process for business:
Through sales forecasting, you can also identify and rectify any kinks in the sales pipeline ahead of time to ensure your business performance remains robust throughout the entire period. When it comes to inventory management, most eCommerce business owners know all too well that too little or too much inventory can be detrimental to operations.
Q11) What are the types of demand forecasting?
A11) Types of demand forecasting
Most traditional demand forecasting techniques fall into one of three basic categories:
Qualitative forecasting techniques are used when there is little data available, such as in a relatively new business or when a product is brought to market. In this case, use expert opinion, market research, comparative analysis, and other information to make a quantitative estimate of your demand.
This approach is often used in areas like technology, where new products may be unprecedented, and customer interest is difficult to gauge ahead of time.
2. Time series analysis
When historical data for a product or product line is available and trends are clear, companies tend to use a time series analysis approach to forecast demand. Time series analysis helps identify seasonal fluctuations in demand, cyclical patterns, and key sales trends.
The time series analysis approach is most effectively used by well-established businesses who have several years’ worth of data to work from and relatively stable trend patterns.
3. Causal models
Causal models are the most sophisticated and complex forecasting tools for businesses because they use specific information about the relationships between variables that affect market demand, such as competitors, economic strength, and other socio-economic factors. Like time series analysis, historical data is the key to making predictions for causal models.
For example, an ice cream business could create a causal model forecast by looking at factors such as their historical sales data, marketing budget, promotional activities, any new ice cream stores in their area, their competitors’ prices, the weather, overall demand for ice cream in their area, and even their local unemployment rate.
Q12) What do you mean by supply?
A12) In ordinary language, the supply of a good means the quantity of the good that is available for sale in the market. Although a good is supplied in the market through the distributors, wholesalers, retailers and many other agencies, the ultimate supplier of a good is the firm that produces it, and it is assumed that the quantity supplied of a good per period is the same as the quantity produced of it per period.
Supply of a good in economics means the quantity produced and supplied of the good per period by its producer-firm(s) at any particular price of the good. However, supply depends on many things other than the price of the good.
For example, supply may depend on the cost of production of the good, the size and method of production, the business organisation of the firms producing it, the nature of the good, i.e., its perishability and lumpiness, the length of time obtained for effecting changes in the quantity produced, etc.
Q13) What is Law of Supply?
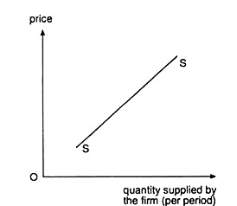
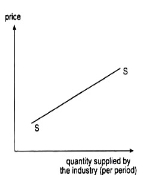
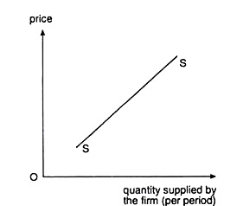
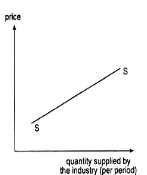
A13) If the price of the good increases or decreases, an individual firm’s supply of the good would, generally, also increase or decrease. This is known as the law of supply. Owing to this law, an individual supply curve would generally slope upward towards right or would be positively sloped like the curves SS shown in Fig. 4 and 5.
Q14) What is the formulae foe elasticity of supply?
A14) Es= (dq/dp) ×(p/q)
Here dq/dp is the slope of the supply curve.
Q15) Explain the types of elasticity of Supply.
A15) Types of Elasticity of supply
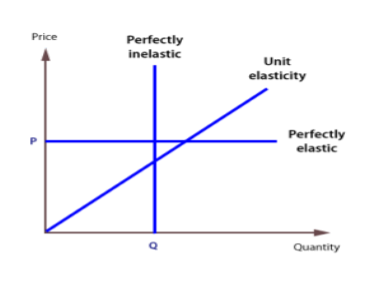
A service or goods, whatever the price, will be a completely inelastic supply if a certain quantity can be supplied. The elasticity of the supply of such services and goods is zero. A completely inelastic supply curve is a straight line parallel to the Y axis. This represents the fact that supply remains the same regardless of price.
2. Unitary Elastic
For a product with unit elasticity of supply, the change in the supply of the product is exactly the same as the change in its price. In other words, changes in both the price and supply of goods are proportional and equal to each other. To point out, the elasticity of the supply in such cases is equal to 1. In addition, a single elastic supply curve passes through the origin.
3. Perfectly Elastic supply
A commodity with a perfectly elastic supply has an infinite elasticity. In such a case the supply becomes zero with even a slight fall in the price and becomes infinite with a slight rise in price. This is indicative of the fact that the suppliers of such a commodity are willing to supply any quantity of the commodity at a higher price. A perfectly elastic supply curve is a straight line parallel to the X-axis.
Q16) In the case of demand curve movement, it:
a. Move upwards or downwards
b. Move left or right
c. Both of the above
d. None of the above
A16) The demand curve movement occurs when all other factors affecting the requested
quantity remain constant and only the price changes. Therefore, demand moves
upwards or downwards along the same curve. So, the correct answer is Option A.
Unit - 1
Introduction To Economics
Q1) What is decision making in Economics?
A1) Economic decision making is the process of making business decisions involving money. The purpose of making these decisions is generally to come up with strategies that help to either make the company more valuable or to increase the owner's revenue. Those involved in the decision-making process must have access to the company's detailed financial reports and must have a good understanding of the company's economic climate.
Success in the world of business depends on a company's leader ability to make wise economic decisions. Since economic decisions have to do with the amount of money a business earns or is valued at, it is essential that the decision-making process relies heavily on the company's financial reports. The outcome of the decisions being made should involve some type of monetary reward, and the decision-makers generally expect the reward to be much greater than the cost or sacrifice that's required to obtain it.
Financial decisions that benefit an organization often involve spending money. This money is often used to expand marketing strategies, recruit talent, increase production, improve product quality, and more. Financial decisions can also include the dismissal of an employee, the discontinuation of a particular product, the sale of a drink from a business, or the acquisition of a loan from a financial institution.
Q2) What do you mean by Engineering Economics?
A2) Engineering is the profession of applying mathematical and natural science knowledge gained through research experience and practice to judgments to develop ways to economically utilize natural materials and powers for the benefit of mankind.
Engineering economics is a very important theme for engineers. This subject helps to understand the need for knowledge of economics to become an effective manager and decision maker. The Economics theories are used to take decisions related to uncertain and changing business environment. Engineering economics quantifies the benefits and costs associated with engineering projects to determine if they can save enough money to justify capital investment. Engineering economics needs to apply the principles of engineering design and analysis in order to provide products and services that satisfy consumers at an affordable cost.
Q3) What are the features of Engineering Economics?
A3)
1. Engineering economics is closely linked to traditional microeconomics.
2. Engineering Economics is dedicated to problem solving and decision making at the operational level.
3. Engineering economics can lead to sub-optimization of the conditions under which a solution achieves tactical goals at the expense of strategic effectiveness.
4. Engineering economics helps identify alternative uses for limited resources and select preferred course of action.
5. Engineering Economics integrates economic theory with engineering practice.
Q4) What do you mean by demand analysis?
A4) Demand analysis is the process by which management makes decisions regarding production, cost allocation, advertising, inventory holding, and pricing. The amount an enterprise produces depends on its production capacity, but depends on how much it has to strive for production.
Thus, the marketer is required to analyze properly the demand for its product in the market and must hold inventory accordingly. Such as if there is a potential demand in the future, then the firm should hold more inventories and in case there is no demand, then the production remains unwarranted, and hence, lesser inventories are held.
There is a possibility that production might exceed the demand, then the marketer must use alternative ways such as better advertisements to create a new demand. The demand shows the relationship between two economic variables, the price of the product and the quantity of product that a consumer is willing to buy for a given period of time, other things being equal
Q5) What are the characteristics of Demand?
A5) The following are the main characteristics or characteristics of the demand that the marketer must take into account when analyzing the demand for his product:
Q6) Define elasticity of demand.
A6) Price elasticity of demand measures the degree of responsiveness of demand to changes in the price of goods. Therefore, its measurement depends on comparing the rate of change in prices with the rate of change in the resulting volume of demand.
There are slight problems with calculating the rate of change in this way. Depending on whether you move the demand curve up or down, you will get different answers. 1 way to avoid this difficulty is to take the average of 2 prices and 2 quantities in the range you are considering and compare the change in the mean, rather than comparing it with the price or quantity at the start of the change.
The formula for calculating the price elasticity of demand looks.
Q7) What do you mean by Elastic demand? Explain with the diagram.
A7) Elasticity of demand is illustrated in Figure 1. Note that a change in price results in a large change in quantity demanded. An example of products with an elastic demand is consumer durables. These are items that are purchased infrequently, like a washing machine or an automobile, and can be postponed if price rises. For example, automobile rebates have been very successful in increasing automobile sales by reducing price.
Close substitutes for a product affect the elasticity of demand. If another product can easily be substituted for your product, consumers will quickly switch to the other product if the price of your product rises or the price of the other product declines. For example, beef, pork and poultry are all meat products. The declining price of poultry in recent years has caused the consumption of poultry to increase, at the expense of beef and pork. So, products with close substitutes tend to have elastic demand.
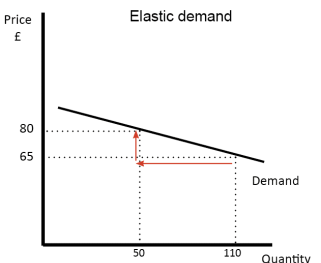
Figure: Elastic Demand
Q8) What is Unitary elastic?
A8) If the elasticity coefficient is equal to one, demand is unitarily elastic as shown in Figure 3. For example, a 10% quantity change divided by a 10% price change is one. This means that a 1% change in quantity occurs for every 1% change in price.
Q9) What is demand forecasting?
A9) Demand forecasting is the process of estimating future customer demand for a defined period of time using historical data and other information.
Good demand forecasting gives companies valuable information about their current and other market potential, allowing managers to make informed decisions about pricing, business growth strategies, and market potential.
Q10) Why is demand forecasting important?
A10) There are a number of reasons why demand forecasting is an important process for business:
Through sales forecasting, you can also identify and rectify any kinks in the sales pipeline ahead of time to ensure your business performance remains robust throughout the entire period. When it comes to inventory management, most eCommerce business owners know all too well that too little or too much inventory can be detrimental to operations.
Q11) What are the types of demand forecasting?
A11) Types of demand forecasting
Most traditional demand forecasting techniques fall into one of three basic categories:
Qualitative forecasting techniques are used when there is little data available, such as in a relatively new business or when a product is brought to market. In this case, use expert opinion, market research, comparative analysis, and other information to make a quantitative estimate of your demand.
This approach is often used in areas like technology, where new products may be unprecedented, and customer interest is difficult to gauge ahead of time.
2. Time series analysis
When historical data for a product or product line is available and trends are clear, companies tend to use a time series analysis approach to forecast demand. Time series analysis helps identify seasonal fluctuations in demand, cyclical patterns, and key sales trends.
The time series analysis approach is most effectively used by well-established businesses who have several years’ worth of data to work from and relatively stable trend patterns.
3. Causal models
Causal models are the most sophisticated and complex forecasting tools for businesses because they use specific information about the relationships between variables that affect market demand, such as competitors, economic strength, and other socio-economic factors. Like time series analysis, historical data is the key to making predictions for causal models.
For example, an ice cream business could create a causal model forecast by looking at factors such as their historical sales data, marketing budget, promotional activities, any new ice cream stores in their area, their competitors’ prices, the weather, overall demand for ice cream in their area, and even their local unemployment rate.
Q12) What do you mean by supply?
A12) In ordinary language, the supply of a good means the quantity of the good that is available for sale in the market. Although a good is supplied in the market through the distributors, wholesalers, retailers and many other agencies, the ultimate supplier of a good is the firm that produces it, and it is assumed that the quantity supplied of a good per period is the same as the quantity produced of it per period.
Supply of a good in economics means the quantity produced and supplied of the good per period by its producer-firm(s) at any particular price of the good. However, supply depends on many things other than the price of the good.
For example, supply may depend on the cost of production of the good, the size and method of production, the business organisation of the firms producing it, the nature of the good, i.e., its perishability and lumpiness, the length of time obtained for effecting changes in the quantity produced, etc.
Q13) What is Law of Supply?
A13) If the price of the good increases or decreases, an individual firm’s supply of the good would, generally, also increase or decrease. This is known as the law of supply. Owing to this law, an individual supply curve would generally slope upward towards right or would be positively sloped like the curves SS shown in Fig. 4 and 5.
Q14) What is the formulae foe elasticity of supply?
A14) Es= (dq/dp) ×(p/q)
Here dq/dp is the slope of the supply curve.
Q15) Explain the types of elasticity of Supply.
A15) Types of Elasticity of supply
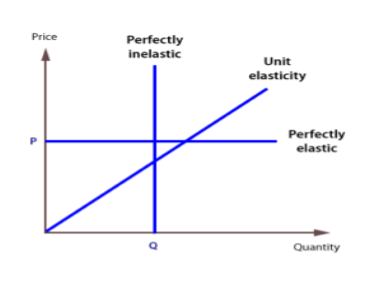
A service or goods, whatever the price, will be a completely inelastic supply if a certain quantity can be supplied. The elasticity of the supply of such services and goods is zero. A completely inelastic supply curve is a straight line parallel to the Y axis. This represents the fact that supply remains the same regardless of price.
2. Unitary Elastic
For a product with unit elasticity of supply, the change in the supply of the product is exactly the same as the change in its price. In other words, changes in both the price and supply of goods are proportional and equal to each other. To point out, the elasticity of the supply in such cases is equal to 1. In addition, a single elastic supply curve passes through the origin.
3. Perfectly Elastic supply
A commodity with a perfectly elastic supply has an infinite elasticity. In such a case the supply becomes zero with even a slight fall in the price and becomes infinite with a slight rise in price. This is indicative of the fact that the suppliers of such a commodity are willing to supply any quantity of the commodity at a higher price. A perfectly elastic supply curve is a straight line parallel to the X-axis.
Q16) In the case of demand curve movement, it:
a. Move upwards or downwards
b. Move left or right
c. Both of the above
d. None of the above
A16) The demand curve movement occurs when all other factors affecting the requested
quantity remain constant and only the price changes. Therefore, demand moves
upwards or downwards along the same curve. So, the correct answer is Option A.