Particulars | Amount | Particulars | Amount |
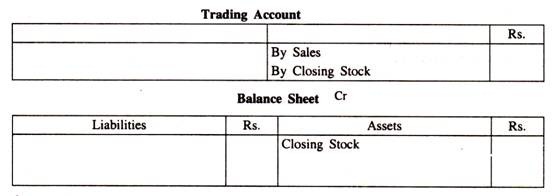
To opening stock | xxx | By sales | xxx |
To purchase | xxx | Less: Returns | xxx |
Less: returns | xxx | By Closing stock | xxx |
To direct expenses: | xxx | By Gross loss c/d |
|
Freight & carriage | xxx |
|
|
Custom & insurance | xxx |
|
|
Wages | xxx |
|
|
Gas, water & fuel | xxx |
|
|
Factory expenses | xxx |
|
|
Royalty on production | xxx |
|
|
To Gross profit c/d | xxx |
|
|
Particulars | Amount | Particulars | Amount |
To Gross loss b/d | xxx | To Gross profit b/d | xxx |
Management expenses: | xxx | Income: | xxx |
To salaries | xxx | By Discount received | xxx |
To office rent, rates, and taxes | xxx | By Commission received | xxx |
To printing and stationery | xxx | Non-trading income: | xxx |
To Telephone charges | xxx | By Bank interest | xxx |
To Insurance | xxx | By Rent received | xxx |
To Audit fees | xxx | By Dividend received | xxx |
To Legal charges | xxx | By Bad debts recovered | xxx |
To Electricity charges | xxx | Abnormal gains: | xxx |
To Maintenance expenses | xxx | By Profit on sale of machinery | xxx |
To Repairs and renewals | xxx | By Profit on sale of investments | xxx |
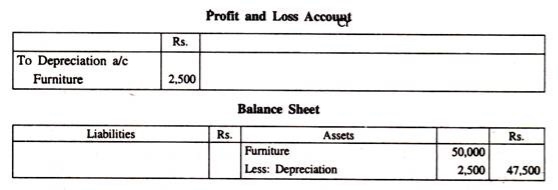
To Depreciation | xxx | By Net Loss(transferred to Capital A/c) | xxx |
Selling distribution expenses: |
|
|
|
To Salaries | xxx |
|
|
To Advertisement | xxx |
|
|
To Godown | xxx |
|
|
To Carriage outward | xxx |
|
|
To Bad debts | xxx |
|
|
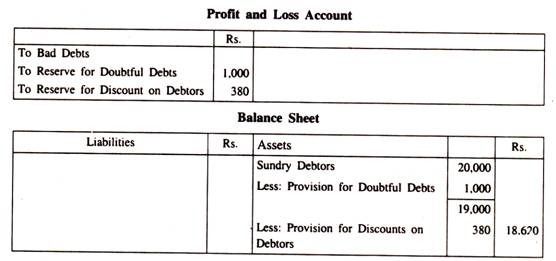
To Provision for bad debts | xxx |
|
|
To Selling commission | xxx |
|
|
Financial expenses: |
|
|
|
To Bank charges | xxx |
|
|
To Interest on loan | xxx |
|
|
To Discount allowed | xxx |
|
|
Abnormal losses: | xxx |
|
|
To Loss on sale of machinery | xxx |
|
|
To Loss on sale of investments | xxx |
|
|
To Loss by fire | xxx |
|
|
To Net Profit(transferred to capital a/c) | xxx |
|
|
TOTAL |
| TOTAL |
|
|
Balance sheet
|
|
|
|
|
|
|
|
Particulars | Rs | Particulars | Rs |
Stock (1-4-2015) Purchase Wages Carriage inwards Freight inward | 10,000 1,60,000 30,000 10,000 8,000 | Sales Returns inward Return outward Gas and Fuel | 3,00,000 16,000 10,000 8,000 |
Particulars | Rs | RS | Particulars | Rs | Rs |
To Opening Stock To purchase Less: Return outwards To wages Add: Outstanding To carriage inwards To freight inwards To Gas and fuel Less: Prepaid To Gross profit c/d |
1,60,000 10,000 | 10,000
1,50,000
34,000 10,000 8,000
7,000 85,000
| By Sales Less: Returns inward BY Closing Stock | 30,00,000 16,000 |
2.84,000 20,000
|
| |||||
30,000 4,000 | |||||
8,000 1,000 | |||||
| |||||
3,04,00 | |||||
3,04,00 | |||||
|
|
Particulars | Rs | Particulars | Rs |
Gross profit Rent paid Salaries Commissions (Cr.) Discount received Insurance Premium paid | 1,00,000 22,000 10,000 12,000 2,000 8,000 | Interest received Bad debts Provisions for bad debts(1-4-2016) Sundry debtors Buildings | 6,000 2,000 4,000 40,000 80,000 |
Particulars | Rs | RS | Particulars | Rs | Rs |
To Rent Add: Outstanding (22,000x1/11) To Salaries Add: Outstanding To Insurance premium
Less: Prepaid insurance To Provision for bad and doubtful debts(closing)
Add: Bad debts Add: Further bad debts
Less: Opening provisions for bad and doubtful debts To Depreciate on building (80,000 x 10%)
To Net profit (transferred to capital A/c)
| 22,000 2,000 |
24,000
14,000
6,000
2,900 8,000 | By Gross profit b/d By Commission
Less: Received in advance By Discount received By interest received Add: Accrued | - 12,000 2,000 | 1,00,000
10,000 2,000
8,000
|
10,000 4,000 | 6,000
2,000 | ||||
8,000 2,000 | |||||
1,900 2,000 3,000
| |||||
6,900
4,000 | |||||
| |||||
65,100 | |||||
1,20,000 | |||||
1,20,000 |
Particulars | Rs | Particulars | Rs |
Gross profit Salaries Office rent paid Advertisement | 50,000 18,000 12,000 8,000 | Rent received Discount received Carriage outwards Fire insurance premium | 2,000 3,000 2,500 6,500 |
Particulars | Rs | RS | Particulars | Rs | Rs |
To Salaries To Office rent To Advertisement To Carriage outwards To Fire insurance premium Less: Prepaid To Manager’s commission To Net profit (transferred to capital account) |
6,500 1,500 | 18,000 12,000 8,000 2,500
5,000 1,000
9,000 | By Gross profit b/d By Rent received Add: Rent accrued By Discount received |
2,000 500 | 50,000
2,500 3,000
55,500 |
| |||||
55,500 |
Particulars | Rs | Rs | Particulars | Rs | Rs |
To Salaries To Office Rent To Advertisement To Carriage outwards To Fire insurance premium Less: Prepaid TO Manager’s commission To Net profit (transferred to capital account) |
6,500 1,500 | 18,000 12,000 8,000 2,500
5,000 1,000
9,000
55,500 | By Gross profit/d By Rent received Add: Rent accrued By Discount received |
2,000 500 | 50,000
2,500 3,000
55,500 |
| |||||
|
Particulars | Rs | Particulars | Rs |
Stock on 01.01.2016 Purchase Sales Expenses on purchase Bank charges paid | 9,000 22,000 42,000 1,500 3,500 | Bad debts Sundry expenses Discount allowed Expenses on sale Repairs on office furniture | 1,200 1,800 1,700 1,000 600 |
Particulars | Rs. | Particulars | Rs |
To Opening stock To Purchase To Expense’s on purchase To Gross profit c/d
To Bank charges To Bad debts To Sundry expenses To Discount allowed TO Expense on sale To Repairs on office furniture TO Manager’s commission To Net profit (transferred to capital A/c) | 9,000 22,000 1,500 14,000 | By Sales By Closing stock
By Gross profit b/d | 42,000 4,500
|
46,500 | 46,500 | ||
3,500 1,200 1,800 1,700 1,000 600 200 4,000
| 14,000
| ||
14,000 | 14,000 |
Particulars | Rs | Particulars | Rs |
Capital Drawings Cash in hand Loan from Bank Bank over draft Investment Bills receivables | 2,00,000 40,000 15,000 40,000 20,000 20,000 10,000 | Sundry creditors Bill payable Goodwill Sundry debtor Land and Building Vehicles Cash at bank | 40,000 20,000 60,000 80,000 50,000 80,000 25,000 |
Particulars | Rs | Rs | Particulars | Rs | Rs |
Capital Add: Net profit Add: Interest on capital
Less: Drawings Loan from bank
Add: Interest outstanding Bills payable Sundry creditors Bank overdraft Add: Interest outstanding
Outstanding liabilities Salaries Wages | 2,00,000 96,000 20,000 |
2,76,000
46,000 20,000 40,000
23,000
30,000
| Good will Land and Building Vehicles Less: Depreciation
Investment Stock in trade Sundry debtors Less: Bad debts
Less: Provision for bad and doubtful debts
Bills receivable Cash at bank Cash in hand |
80,000 8,000 | 60,000 50,000
72,000 20,000 1,20,000
63,000
10,000 25,000 15,000
|
3,16,000 40,000 | |||||
80,000 10,000 | |||||
40,000
6,000 | |||||
20,000 3,000 | 70,000
7,000 | ||||
10,000 20,000 |
| ||||
4,35,000 | |||||
| 4,35,000 |
Particular | Rs | Paricular | Rs |
Purchase Return inward Opening stock Freight inwards Wages Investments Bank Charges Land Machinery Buildings Cash at bank Cash in hand | 75,000 2,000 10,000 4,000 2,000 10,000 1,000 30,000 30,000 25,000 18,000 4,000 2,11,000 | Capital Creditors Sales Return outwards | 60,000 30,000 1,20,000 1,000
2,11,000 |
Particulars | RS | Rs | Particulars | Rs | Rs |
To Opening stock TO Purchase Less: Return outward To Freight inwards To wages To Gross profit c/d
To Depreciation on machinery To Bank charges To Net profit (transferred to a/c) |
75,000 1,000 | 10,000
74,000 4,000 2,000 37,000 | By Sales Less: Return inward
By Closing stock
By Gross profit b/d BY Accrued interest on investment | 1,20,000 2,000 |
1,18,000
9,000
|
| |||||
| |||||
1,27,000 | 1,27,000 | ||||
3,000 1,000 35,000 |
37,000 2,000
| ||||
39,000 | |||||
39,000 |
Particulars | RS | Rs | Particulars | Rs | Rs |
Capital Add: Net profit Creditors | 60,000 35,000
|
95,000 30,000
| Land Building Machinery Less Depreciation Investment Add: Accrued interest Stock in trade Cash at bank Cash in hand
|
30,000 3,000 | 30,000 25,000
27,000
12,000 9,000 18,000 4,000
|
10,000 2,000 |
Particulars | Rs | Particulars | Rs |
Purchase Wages Freight inwards Advertisement Carriage outwards Cash Machinery Debtors Bills receivable Stock on 1st January, 2016 | 10,000 600 750 500 400 1,200 8000 2,250 300 1,000 25,000 | Sales Commission received Rent received Creditors Capital | 15,100 1,900 600 2,400 5,000
25,000 |
Particulars | Rs | Rs | Particulars | Rs | Rs |
To Opening stock To Purchase TO Wages Add: Outstanding To Freight inwards To Gross profit c/d
TO Advertisement Less: Prepaid advertisement To Carriage outwards TO Net profit (transferred to capital a/c) |
600 200 | 1,000 10,000
800 750 4,650 | By Sales By Closing stock
By Gross profit b/d By Commission received Less: Received in advance By Rent received |
1,900 400 | 15,100 2,100
|
500 150 | |||||
17,200 | 17,200 4,650 | ||||
350 400
6,000
|
1,500 600
| ||||
| |||||
| |||||
6,750 | 6,750 |
Capital Debtors Creditors Purchase Sales Income tax of Jain paid Opening stock | 20,000 8,000 10,500 60,00 80,000 500 12,000 | Offices Salaries Establishment expenses Selling expense Furniture Cash at bank Miscellaneous receipt Drawings | 6,600 4,500 2,300 10,000 2,400 600 4,800 |
Particular | Rs | Rs | Particular | Rs | Rs |
To Opening Stock To Purchase To Gross Profit c/d
To Office salaries Add: Outstanding To Establish expenses To Selling expenses To Depreciation on furniture (10,000 x 10%) To interest on capital (20,000 x 5%) To Net profit (transferred to capital a/c) |
6,600 600 | 12,000 60,000 22,000 | By sales By closing stock
By Gross Profit b/d By miscellaneous receipt |
| 80,000 4,000 |
94,000 |
94,000 | ||||
72,00 4,500 2,300 1,000
1000
6,600
| 22,000
600
| ||||
| |||||
22,600 | 22,600 |
Liabilities | Rs | Rs | Assets | Rs | Rs |
Capital Add: Net profit Add: Interest on capital
Less: Drawings 4,800 Income tax 500 Creditors Office salaries outstanding
| 20,000 6,600 1,100 27,600
5,300 |
22,300 10,500 600 | Furniture Less: Depreciation Stock in trade Debtors
Cash at bank | 10,000 1,000 |
9,000 14,000 8,000 2,400 |
| |||||
| |||||
33,400 |
Debit balances | Rs | Credit balances | Rs |
Drawings Sundry debtors Coal, gas and water Return inward Purchase Stock on 1-11-2016 Travelling expenses Interest on loan paid Petty cash Repairs Investment | 5,000 60,000 10,500 2,500 2,56,500 89,700 51,250 300 710 4,090 70,000 | Capital Loan at 6% p.a. Sales Interest on investment Sundry creditors | 1,31,500 20,000 3,56,500 2,550 40,000
|
5,50,550 | 5,50,550 |
Particulars | ₹ | ₹ | Particulars | ₹ | ₹ |
To opening stock To purchase To Coal, gas and water To Gross profit c/d
To travelling expenses To interest on loan paid To Repair To Provide Provision for bad and doubtful debts To Provision for Discount on debtors Net Profit (transferred to capital a/c)
|
300
900 | 89,000 2,56,500 10,500 1,27,300 | By sales Less: Returns inward By Closing stock
By Gross profit b/d By Interest on Investment | 3,56,00 2,500 |
3,54,500 1,30,000 |
| |||||
4,84,000 | |||||
4,84,000 | |||||
51,250
1,200
4,090 3,000
1,140
69,170
|
1,23,300 2,550
| ||||
1,29,850 |
|
| 1,29,850 |
Liabilities | ₹ | ₹ | Assets | ₹ | ₹ |
Capital Add: Net profit
Less: Drawings 6% Loan Add interest outstanding Sundry creditors
| 1,31,500 69,170 2,00,000 5,000 20,000 900 |
1,95,670
20,900 40,000 | Investments Stock in trade Sundry debtors Less: Provision for bad and doubtful debts( 60,000* 5/100) Less: Provision for discount on debtors (57,000*2/100) Pretty cash |
60,000
3,000
57,000 1,140
| 70,000 1,30,000
55,860 710 |
2,56,570 |
Particulars | Debit Rs | Credit Rs |
Stock as on 01-012015 Purchase and Sales Returns Carriage inwards Salaries Insurance Wages Bad Debts Furniture Capital Printing and stationery Cash at bank Petty cash Commissions | 2,00,000 22,00,000 1,00,000 50,000 2,60,000 1,20,000 80,000 10,000 7,00,000
80,000 3,15,000 5,000 10,000 |
33,00,000 80,000
7,50,000 |
| 41,30,000 | 41,30,000 |
Particulars | Rs | Rs | Particulars | Rs | Rs |
To Opening Stock |
| 2,00,000 | By Sales Less: Returns | 33,00,000 1,00,000 |
32,00,000 |
To Purchase Less: Returns | 22,00,000 80,000 |
21,20,000 | By Closing Stock |
| 4,00,000 |
To Carriage inwards |
| 50,000 |
|
|
|
To Wages |
| 80,000 |
|
|
|
To Gross profit c/d |
| 11,50,000 |
|
|
3,60,000 |
36,00,000 | |||||
To Salaries |
| 2,60,000 | By Gross Profit b/d |
| 11,50,000 |
To Insurance Less: Prepaid | 1,20,000 60,000 |
60,000 | By Commissions receivable |
|
50,000 |
To Bad debts |
| 10,000 |
|
|
|
To Printing and stationery |
| 80,000 |
|
|
|
To Depreciation on furniture (7,00,000 x 10/100) |
|
70,000 |
|
|
|
To Commissions |
| 10,000 |
|
|
|
To Net profit (transferred to capital A/c) |
| 7,10,000
|
|
|
|
12,00,00 | |||||
12,00,000 |


