Unit 1
Introduction
Q1) What do you mean by Business Economics? (5marks)
A1)
Business Economics, also called Managerial Economics, is the application of economic theory and methodology to business. Business involves decision-making. Decision making means the process of selecting one out of two or more alternative courses of action. The question of choice arises because the basic resources such as capital, land, labour and management are limited and can be employed in alternative uses. The decision-making function thus becomes one of making choice and taking decisions that will provide the most efficient means of attaining a desired end, say, profit maximation.
Definition
According to Mc Nair and Meriam, “Business economic consists of the use of economic modes of thought to analyse business situations.”
According to Mansfield, “business economics is concerned with the application of economic concepts and economic analysis to the problem of formulating rational decision making”.
Nature of business economics
- Microeconomics - Business economics is microeconomic in character. This is because it studies the problems of an individual business unit. It does not study the problems of the entire economy.
- Normative science - Managerial economics is a normative science. Under particular circumstances it is concerned with what management should do. It determines the goals of the enterprise. Then it develops the ways to achieve these goals.
- Pragmatic - Business economics is pragmatic. It concentrates on making economic theory more application-oriented. It tries to solve the managerial problems in their day-to-day functioning.
- Prescriptive - Managerial economics is prescriptive rather than descriptive. It prescribes solutions to various business problems.
- Uses macroeconomics - Macroeconomics is also useful to business economics. Macro-economics provides an intelligent understanding of the environment in which the business operates.
- Management oriented - The main aim of managerial economics is to help the management in taking correct decisions and preparing plans and policies for the future.
Q2) Define opportunity cost? 5 marks
A2)
Business Economics, also called Managerial Economics, is the application of economic theory and methodology to business. Business involves decision-making. Decision making means the process of selecting one out of two or more alternative courses of action. The question of choice arises because the basic resources such as capital, land, labour and management are limited and can be employed in alternative uses. The decision-making function thus becomes one of making choice and taking decisions that will provide the most efficient means of attaining a desired end, say, profit maximation.
Definition
According to Mc Nair and Meriam, “Business economic consists of the use of economic modes of thought to analyse business situations.”
According to Mansfield, “business economics is concerned with the application of economic concepts and economic analysis to the problem of formulating rational decision making”.
Opportunity cost principle
By opportunity cost of a decision is meant the sacrifice of alternatives required by that decision. If there are no sacrifices, there is no cost. According to Opportunity cost principle, a firm can hire a factor of production if and only if that factor earns a reward in that occupation/job equal or greater than it’s opportunity cost. Opportunity cost is the minimum price that would be necessary to retain a factor service in it’s given use. It is also defined as the cost of sacrificed alternatives. For instance, a person chooses to forgo his present lucrative job which offers him Rs.50000 per month, and organizes his own business. The opportunity lost (earning Rs. 50,000) will be the opportunity cost of running his own business.
More examples are as follows-
- The opportunity cost of the funds employed in one’s own business is equal to the interest that could be earned on those funds if they were employed in other ventures.
- The opportunity cost of the time as an entrepreneur devotes to his own business is equal to the salary he could earn by seeking employment.
- The opportunity cost of using a machine to produce one product is equal to the earnings forgone which would have been possible from other products.
- The opportunity cost of using a machine that is useless for any other purpose is zero since its use requires no sacrifice of other opportunities.
- If a machine can produce either X or Y, the opportunity cost of producing a given quantity of X is equal to the quantity of Y, which it would have produced. If that machine can produce 10 units of X or 20 units of Y, the opportunity cost of 1 X is equal to 2 Y.
For decision-making, opportunity costs are the only relevant costs. The opportunity cost principle may be stated as under: “The cost involved in any decision consists of the sacrifices of alternatives required by that decision. If there are no sacrifices, there is no cost.” Thus in macro sense, the opportunity cost of more guns in an economy is less butter. That is the expenditure to national fund for buying armor has cost the nation of losing an opportunity of buying more butter. Similarly, a continued diversion of funds towards defense spending, amounts to a heavy tax on alternative spending required for growth and development.
Q3) Distin guish between Marginalism & Incrementalism? 5 marks
A3)
Business Economics, also called Managerial Economics, is the application of economic theory and methodology to business. Business involves decision-making. Decision making means the process of selecting one out of two or more alternative courses of action. The question of choice arises because the basic resources such as capital, land, labour and management are limited and can be employed in alternative uses. The decision-making function thus becomes one of making choice and taking decisions that will provide the most efficient means of attaining a desired end, say, profit maximation.
Definition
According to Mc Nair and Meriam, “Business economic consists of the use of economic modes of thought to analyse business situations.”
According to Mansfield, “business economics is concerned with the application of economic concepts and economic analysis to the problem of formulating rational decision making”.
Marginalism
Rational decision makers will always think in terms of marginal quantities. One should compare the cost of an additional chocolate with the benefits of an extra chocolate in order to decide whether to have it or not. If the additional revenue that the producer is going to get by producing one more car is greater than the cost of producing the extra car, only then the seller will produce an extra car.
Let us take one example, an additional car sells for Rs. 10 lacks while it costs only Rs. 8 lakhs to produce the additional car. Clearly, a rational producer will decide to produce the car because he will make profit of Rs. 2 lakhs per car. On the other hand, if the price of car falls to Rs.7 lakhs while the cost of producing it remains Rs. 8 lakh, it will not make sense to produce the additional car since the cost surpasses the revenue to be earned from it. The cost of producing the extra car is called as marginal cost while the revenue obtained from selling an extra car is called as marginal revenue. If marginal revenue exceeds marginal cost, it obviously makes sense to produce the extra car. If the marginal revenue is less than marginal cost, it not advisable to produce the extra car.
Let us take another example from your day to day life. Suppose you may score 10 additional marks in economics by studying for entire night. Getting the additional 10 marks is important because it makes you feel happy and proud. But suppose staying up for entire night makes you feel really sleepy in the morning hence makes you feel dull and unhappy. In this case, whether you should study for entire night depends upon whether the happiness that you get from the 10 additional marks in economics overshadows the unhappiness caused by the additional sleeplessness. In this way individuals can make use of marginalism principal in their day to day life for making appropriate decisions.
Incrementalism
Marginalism represents small unit change in the concerned variables. But many times in real life situations changes takes place in chunks or batches. For example firm producing car will not generally increase its production by one unit, but by a batch of additional units. Here we use concept of incrementalism instead of marginalism and decision will be taken by comparing incremental cost and incremental revenue.
Q4) Explain scope and importance of business economics? 8 marks
A4)
Business Economics, also called Managerial Economics, is the application of economic theory and methodology to business. Business involves decision-making. Decision making means the process of selecting one out of two or more alternative courses of action. The question of choice arises because the basic resources such as capital, land, labour and management are limited and can be employed in alternative uses. The decision-making function thus becomes one of making choice and taking decisions that will provide the most efficient means of attaining a desired end, say, profit maximation.
Definition
According to Mc Nair and Meriam, “Business economic consists of the use of economic modes of thought to analyse business situations.”
According to Mansfield, “business economics is concerned with the application of economic concepts and economic analysis to the problem of formulating rational decision making”.
Nature of business economics
- Microeconomics - Business economics is microeconomic in character. This is because it studies the problems of an individual business unit. It does not study the problems of the entire economy.
- Normative science - Managerial economics is a normative science. Under particular circumstances it is concerned with what management should do. It determines the goals of the enterprise. Then it develops the ways to achieve these goals.
- Pragmatic - Business economics is pragmatic. It concentrates on making economic theory more application-oriented. It tries to solve the managerial problems in their day-to-day functioning.
- Prescriptive - Managerial economics is prescriptive rather than descriptive. It prescribes solutions to various business problems.
- Uses macroeconomics - Macroeconomics is also useful to business economics. Macro-economics provides an intelligent understanding of the environment in which the business operates.
- Management oriented - The main aim of managerial economics is to help the management in taking correct decisions and preparing plans and policies for the future.
Scope of business economics
- Demand Analysis and Forecasting: A business firm is an economic organisation which transform productive resources into goods to be sold in the market. A major part of business decision making depends on accurate estimates of demand. A demand forecast can serve as a guide to management for maintaining and strengthening market position and enlarging profits. Demands analysis helps identify the various factors influencing the product demand and thus provides guidelines for manipulating demand.
- Cost and Production Analysis: A study of economic costs, combined with the data drawn from the firm’s accounting records, can yield significant cost estimates which are useful for management decisions. An element of cost uncertainty exists because all the factors determining costs are not known and controllable. Discovering economic costs and the ability to measure them are the necessary steps for more effective profit planning, cost control and sound pricing practices. Production analysis is narrower, in scope than cost analysis. Production analysis frequently proceeds in physical terms while cost analysis proceeds in monetary terms.
- Pricing Decisions, Policies and Practices: Pricing is an important area of business economic. In fact, price is the genesis of a firms revenue and as such its success largely depends on how correctly the pricing decisions are taken. The important aspects dealt with under pricing include. Price Determination in Various Market Forms, Pricing Method, Differential Pricing, Product-line Pricing and Price Forecasting.
- Profit Management: Business firms are generally organised for purpose of making profits and in the long run profits earned are taken as an important measure of the firms success. If knowledge about the future were perfect, profit analysis would have been a very easy task. However, in a world of uncertainty, expectations are not always realised so that profit planning and measurement constitute a difficult area of business economic.
- Capital Management: Among the various types business problems, the most complex and troublesome for the business manager are those relating to a firm’s capital investments. Relatively large sums are involved and the problems are so complex that their solution requires considerable time and labour.
Importance of business economics
- Importance for administrator administration – With the help of statistics, finance minister makes the use of revenue and expenditure data to prepare budget. Also it helps in taking decision regarding taxes.
- Importance for businessman – Statistics helps in providing relevant data. Thus with the help of those data a business man can estimate demand and supply of the commodity.
- Importance in economics – Statistics helps in measuring economics such as gross national output, consumption, saving, investment, expenditures, etc
- Importance for politician – Politician use statistics in formulating economic, social and educational policies of the country
- Importance in the field of education – Statistics has wide application in education for determining the reliability and viability to a test, factor analysis, etc.
Q5) Write short note on Marginalism.
A5)
Business Economics, also called Managerial Economics, is the application of economic theory and methodology to business. Business involves decision-making. Decision making means the process of selecting one out of two or more alternative courses of action. The question of choice arises because the basic resources such as capital, land, labour and management are limited and can be employed in alternative uses. The decision-making function thus becomes one of making choice and taking decisions that will provide the most efficient means of attaining a desired end, say, profit maximation.
Definition
According to Mc Nair and Meriam, “Business economic consists of the use of economic modes of thought to analyse business situations.”
According to Mansfield, “business economics is concerned with the application of economic concepts and economic analysis to the problem of formulating rational decision making”.
Marginalism
Rational decision makers will always think in terms of marginal quantities. One should compare the cost of an additional chocolate with the benefits of an extra chocolate in order to decide whether to have it or not. If the additional revenue that the producer is going to get by producing one more car is greater than the cost of producing the extra car, only then the seller will produce an extra car.
Let us take one example, an additional car sells for Rs. 10 lacks while it costs only Rs. 8 lakhs to produce the additional car. Clearly, a rational producer will decide to produce the car because he will make profit of Rs. 2 lakhs per car. On the other hand, if the price of car falls to Rs.7 lakhs while the cost of producing it remains Rs. 8 lakh, it will not make sense to produce the additional car since the cost surpasses the revenue to be earned from it. The cost of producing the extra car is called as marginal cost while the revenue obtained from selling an extra car is called as marginal revenue. If marginal revenue exceeds marginal cost, it obviously makes sense to produce the extra car. If the marginal revenue is less than marginal cost, it not advisable to produce the extra car.
Let us take another example from your day to day life. Suppose you may score 10 additional marks in economics by studying for entire night. Getting the additional 10 marks is important because it makes you feel happy and proud. But suppose staying up for entire night makes you feel really sleepy in the morning hence makes you feel dull and unhappy. In this case, whether you should study for entire night depends upon whether the happiness that you get from the 10 additional marks in economics overshadows the unhappiness caused by the additional sleeplessness. In this way individuals can make use of marginalism principal in their day to day life for making appropriate decisions.
Q6) Discuss use of marginal analysis in decision making? 5 marks
A6)
Business Economics, also called Managerial Economics, is the application of economic theory and methodology to business. Business involves decision-making. Decision making means the process of selecting one out of two or more alternative courses of action. The question of choice arises because the basic resources such as capital, land, labour and management are limited and can be employed in alternative uses. The decision-making function thus becomes one of making choice and taking decisions that will provide the most efficient means of attaining a desired end, say, profit maximation.
Definition
According to Mc Nair and Meriam, “Business economic consists of the use of economic modes of thought to analyse business situations.”
According to Mansfield, “business economics is concerned with the application of economic concepts and economic analysis to the problem of formulating rational decision making”.
Margnalism
Rational decision makers will always think in terms of marginal quantities. One should compare the cost of an additional chocolate with the benefits of an extra chocolate in order to decide whether to have it or not. If the additional revenue that the producer is going to get by producing one more car is greater than the cost of producing the extra car, only then the seller will produce an extra car.
Let us take one example, an additional car sells for Rs. 10 lacks while it costs only Rs. 8 lakhs to produce the additional car. Clearly, a rational producer will decide to produce the car because he will make profit of Rs. 2 lakhs per car. On the other hand, if the price of car falls to Rs.7 lakhs while the cost of producing it remains Rs. 8 lakh, it will not make sense to produce the additional car since the cost surpasses the revenue to be earned from it. The cost of producing the extra car is called as marginal cost while the revenue obtained from selling an extra car is called as marginal revenue. If marginal revenue exceeds marginal cost, it obviously makes sense to produce the extra car. If the marginal revenue is less than marginal cost, it not advisable to produce the extra car.
Let us take another example from your day to day life. Suppose you may score 10 additional marks in economics by studying for entire night. Getting the additional 10 marks is important because it makes you feel happy and proud. But suppose staying up for entire night makes you feel really sleepy in the morning hence makes you feel dull and unhappy. In this case, whether you should study for entire night depends upon whether the happiness that you get from the 10 additional marks in economics overshadows the unhappiness caused by the additional sleeplessness. In this way individuals can make use of marginalism principal in their day to day life for making appropriate decisions.
Use of Marginal analysis in decision making
Marginal analysis implies judging the impact of a unit change in one variable on the 29 other. Marginal generally refers to small changes. Marginal revenue is change in total revenue per unit change in output sold. Marginal cost refers to change in total costs per unit change in output produced (While incremental cost refers to change in total costs due to change in total output). The decision of a firm to change the price would depend upon the resulting impact/change in marginal revenue and marginal cost. If the marginal revenue is greater than the marginal cost, then the firm should bring about the change in price.
Q7) Write short note on Incrementalism? 5 marks
A7)
Business Economics, also called Managerial Economics, is the application of economic theory and methodology to business. Business involves decision-making. Decision making means the process of selecting one out of two or more alternative courses of action. The question of choice arises because the basic resources such as capital, land, labour and management are limited and can be employed in alternative uses. The decision-making function thus becomes one of making choice and taking decisions that will provide the most efficient means of attaining a desired end, say, profit maximation.
Definition
According to Mc Nair and Meriam, “Business economic consists of the use of economic modes of thought to analyse business situations.”
According to Mansfield, “business economics is concerned with the application of economic concepts and economic analysis to the problem of formulating rational decision making”.
Nature of business economics
- Microeconomics - Business economics is microeconomic in character. This is because it studies the problems of an individual business unit. It does not study the problems of the entire economy.
- Normative science - Managerial economics is a normative science. Under particular circumstances it is concerned with what management should do. It determines the goals of the enterprise. Then it develops the ways to achieve these goals.
- Pragmatic - Business economics is pragmatic. It concentrates on making economic theory more application-oriented. It tries to solve the managerial problems in their day-to-day functioning.
- Prescriptive - Managerial economics is prescriptive rather than descriptive. It prescribes solutions to various business problems.
- Uses macroeconomics - Macroeconomics is also useful to business economics. Macro-economics provides an intelligent understanding of the environment in which the business operates.
- Management oriented - The main aim of managerial economics is to help the management in taking correct decisions and preparing plans and policies for the future.
Incrementalism
Incremental principle states that a decision is profitable if revenue increases more than costs; if costs reduce more than revenues; if increase in some revenues is more than decrease in others; and if decrease in some costs is greater than increase in others.
The incremental concept is closely related to the marginal costs and marginal revenues of economic theory. Incremental concept involves two important activities which are as follows:
- Estimating the impact of decision alternatives on costs and revenues.
- Emphasising the changes in total cost and total cost and total revenue resulting from changes in prices, products, procedures, investments or whatever may be at stake in the decision.
The two basic components of incremental reasoning are as follows:
- Incremental cost: Incremental cost may be defined as the change in total cost resulting from a particular decision.
- Incremental revenue: Incremental revenue means the change in total revenue resulting from a particular decision.
Incremental analysis differs from marginal analysis only in that it analysis the change in the firm's performance for a given managerial decision, whereas marginal analysis often is generated by a change in outputs or inputs. Incremental analysis is generalization of marginal concept. It refers to changes in cost and revenue due to a policy change. For example - adding a new business, buying new inputs, processing products, etc. Change in output due to change in process, product or investment is considered as incremental change. Incremental principle states that a decision is profitable if revenue increases more than costs; if costs reduce more than revenues; if increase in some revenues is more than decrease in others; and if decrease in some costs is greater than increase in others.
Q8) Explain following concepts a. Variables b. Functions c. Equations d. Graph e. Curves f. Slopes? 5 marks
A8)
The Relationship between Total, Average and Marginal can be explained with the help of concepts like utility, cost, revenue etc. Here we will take example of revenue concepts.
Where, P = Price & Q = Quantity
TR = Total Revenue
AR = Average Revenue
MR = Marginal Revenue
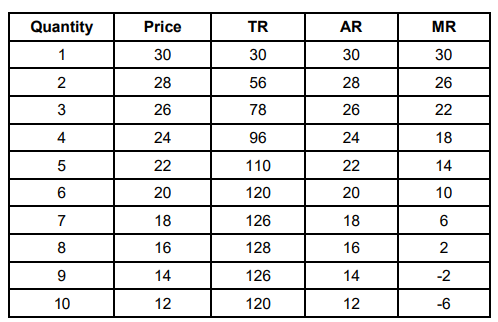
Total revenue is calculated by multiplying price and quantity. As quantity increases TR increases initially then it decreases. AR is same as price. MR decreases constantly and becomes negative eventually.
Important concepts
1. Variables
A variable is magnitude of interest that can be measured. Variables can be endogenous and exogenous variables. Variables can be independent and dependent.
2. Functions
Function shows existence of relationship between two or more variables. It indicates how the value of one variable depends on the value of another one. It does not give any direction of relation.
3. Equations
An equation specifies the relationship between the dependent and independent variables. It specifies the direction of relation.
4. Graph
Graph is a geometric tool used to express the relationship between variables. It is a pictorial representation of data which shows how two or more sets of data or variables are related to one another.
5. Curves
The functional relationship between the variables specified in the form of equations can be shown by drawing line or outline which gradually deviates from being straight for some or all of its length in the graph.
6. Slopes
Slopes show how fast or at what rate, the dependant variable is changing in response to a change in the independent variable.
Q9) What do you mean by market demand? 5 marks
A9)
In economics both demand and supply are the important forces through which market economy functions. Individual’s demand is desire backed by his / her ability and willingness to pay. There is an indirect or negative relationship between price and quantity demanded. Individual Supply is the amount of a product that producer is willing to sell at given prices. There is a direct or positive relationship between price and quantity supplied.
Market demand
Individual demand for a product is based on an individual’s choice / Preference among different products, price of the product, income etc. Individual demand is nothing but desire backed by individual’s ability and willingness to pay. By summing up the demand of all the consumers or individuals for the product we get market demand for that particular product.
Market demand schedule
Price | Demand of Individual A | Demand of Individual A | Market Demand (Demand of Individual A + Demand of Individual B) |
10 | 5 | 7 | 12 |
20 | 4 | 6 | 10 |
30 | 3 | 5 | 8 |
40 | 2 | 4 | 6 |
50 | 1 | 3 | 4 |
The above table represents demand schedule of individual A, individual B and Market Demand. Same schedule can be represented with the help of a graph.
Market demand curve
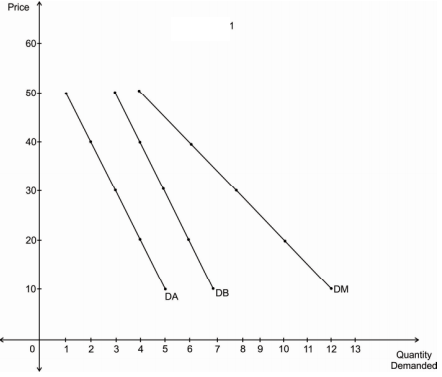
Diagram represents demand curve of individual A, individual B and Market Demand. DA is a demand curve of individual A. DB is the demand curve of individual B. DM is the market demand curve. All curves are downward sloping indicating negative relationship between price and quantity demanded
Q10) What do you mean by market supply? 5 marks
A10)
In economics both demand and supply are the important forces through which market economy functions. Individual’s demand is desire backed by his / her ability and willingness to pay. There is an indirect or negative relationship between price and quantity demanded. Individual Supply is the amount of a product that producer is willing to sell at given prices. There is a direct or positive relationship between price and quantity supplied.
Market supply
Individual Supply is the amount of a product that producer is willing to sell at given prices. By summing up the supply of all the producers for the product we get market supply for that particular product.
Market supply schedule
Price | Supply of Producer A | Supply of Producer B | Market Supply (Supply of Producer A + Supply of Producer B) |
10 | 1 | 3 | 4 |
20 | 2 | 4 | 6 |
30 | 3 | 5 | 8 |
40 | 4 | 6 | 10 |
50 | 5 | 7 | 12 |
The above table represents supply schedule of producer A, producer B and Market supply. Same schedule can be represented with the help of a graph.
Market Supply Curve
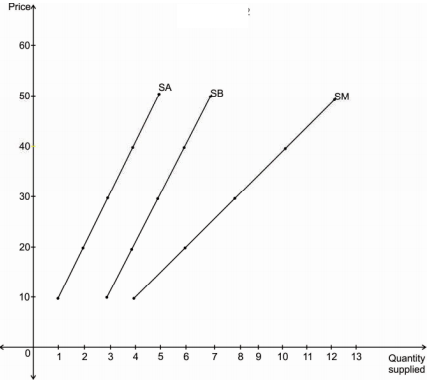
Diagram represents supply curve of producer A, producer B and Market supply. SA is a supply curve of producer A. SB is the supply curve of producer B. SM is the market supply curve. All curves are upward sloping indicating positive relationship between price and quantity demanded.
Q11) Write The basics of market demand, market supply and equilibrium price?12 marks
A11)
In economics both demand and supply are the important forces through which market economy functions. Individual’s demand is desire backed by his / her ability and willingness to pay. There is an indirect or negative relationship between price and quantity demanded. Individual Supply is the amount of a product that producer is willing to sell at given prices. There is a direct or positive relationship between price and quantity supplied.
Market Demand
Individual demand for a product is based on an individual’s choice / Preference among different products, price of the product, income etc. Individual demand is nothing but desire backed by individual’s ability and willingness to pay. By summing up the demand of all the consumers or individuals for the product we get market demand for that particular product.
Market demand schedule
Price | Demand of Individual A | Demand of Individual A | Market Demand (Demand of Individual A + Demand of Individual B) |
10 | 5 | 7 | 12 |
20 | 4 | 6 | 10 |
30 | 3 | 5 | 8 |
40 | 2 | 4 | 6 |
50 | 1 | 3 | 4 |
The above table represents demand schedule of individual A, individual B and Market Demand. Same schedule can be represented with the help of a graph.
Market demand curve
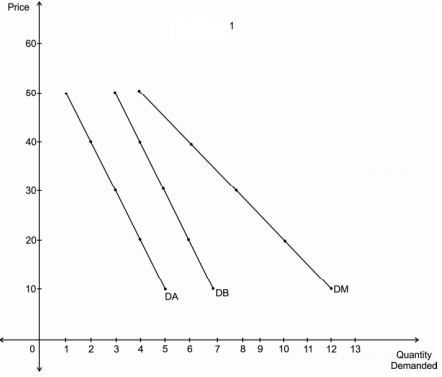
Diagram represents demand curve of individual A, individual B and Market Demand. DA is a demand curve of individual A. DB is the demand curve of individual B. DM is the market demand curve. All curves are downward sloping indicating negative relationship between price and quantity demanded.
Market supply
Individual Supply is the amount of a product that producer is willing to sell at given prices. By summing up the supply of all the producers for the product we get market supply for that particular product.
Market supply schedule
Price | Supply of Producer A | Supply of Producer B | Market Supply (Supply of Producer A + Supply of Producer B) |
10 | 1 | 3 | 4 |
20 | 2 | 4 | 6 |
30 | 3 | 5 | 8 |
40 | 4 | 6 | 10 |
50 | 5 | 7 | 12 |
The above table represents supply schedule of producer A, producer B and Market supply. Same schedule can be represented with the help of a graph.
Market Supply Curve
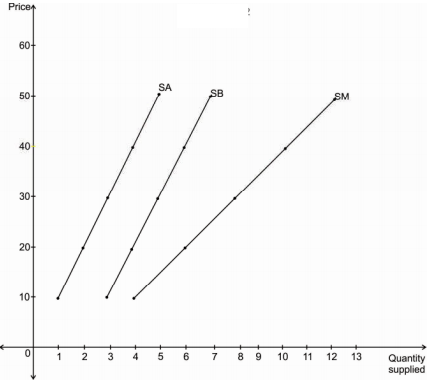
Diagram represents supply curve of producer A, producer B and Market supply. SA is a supply curve of producer A. SB is the supply curve of producer B. SM is the market supply curve. All curves are upward sloping indicating positive relationship between price and quantity demanded.
Equilibrium Price
The market price where the quantity of goods supplied is equal to the quantity of goods demanded is called as equilibrium price. This is the point at which the market demand and market supply curves intersects.
Price | Market demand | Market supply |
10 | 12 | 4 |
20 | 10 | 6 |
30 | 8 | 8 |
40 | 6 | 10 |
50 | 4 | 12 |
The above table represents schedule of equilibrium price. Same schedule can be represented with the help of a graph to locate equilibrium price. Even in the table itself it is very clear that 30 is equilibrium price as at this price, market demand is equal to market supply i.e. 8 units.
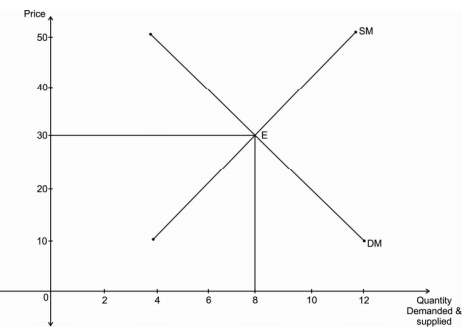
Diagram represents Equilibrium Price. DM is the market demand curve. DM is downward sloping curve indicating inverse or negative relationship between price and quantity demanded. SM is the market supply curve. SM is upward sloping curve indicating direct or positive relationship between price and quantity supplied. DM and SM curves intersect each other at point E where equilibrium price is 30 and equilibrium quantity demanded and supplied is 8 units.
Q12) Write short note on changes in Demand? 5 marks
A12)
The shift in demand curve is when, the price of the commodity remains constant, but there is a change in quantity demanded due to some other factors, causing the curve to shift to a particular side.
Change in demand refers to increase or decrease in demand for a product due to various determinants of demand other than price.
- It is measured by shifts in the demand curve.
- The terms, change in demand means to increase or decrease in demand.
Increase and decrease in demand takes place due to changes in other factors, such as change in income, distribution of income, change in consumer’s tastes and preferences, change in the price of related goods. In this case, the price factor remains unchanged.
Increase in demand
Increase in demand refers to the rise in demand for a product at a specific price,
Decrease in demand
Decrease in demand is the fall in demand for a product at a given price.
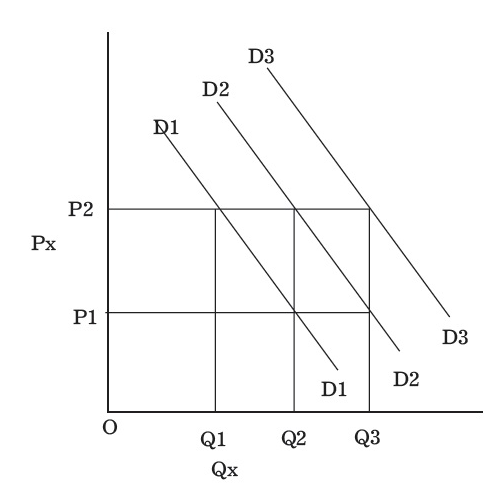
When other factors change, the demand curve changes its position which is referred to as a shift along the demand curve, which is shown in Figure.
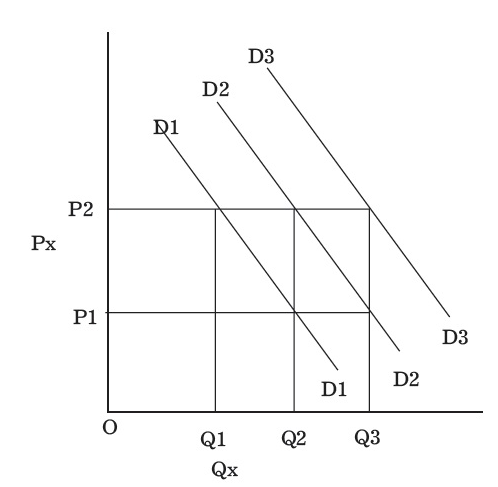
Demand Curve Shift
Demand curve D2 is the original demand curve of commodity X. At price OP2, the demand is OQ2 units of commodity X.
When the consumer’s income decreases owing to high income tax, he is able to purchase only OQ1 unit of commodity X at the same price OP2. Therefore, the demand curve, D2 shifts downwards to D1.
Similarly, when the consumer’s disposable income increases due to a reduction in taxes, they are able to purchase OQ3 units of commodity X at the price OP2. Therefore, the demand curve, D2 shifts upwards to D3. Such changes in the position of the demand curve from its original position are referred to as a shift in the demand curve.
Q13) Write short note on changes in supply? 5 marks
A13)
The shift in supply curve is when, the price of the commodity remains constant, but there is a change in quantity supply due to some other factors, causing the curve to shift to a particular side.
Change in supply refers to increase or decrease in the supply of a product due to various determinants of supply other than price (in this case, price remaining constant).
- It is measured by shifts in supply curve.
- The terms, while a change in supply means an increase or decrease in supply.
Increase and Decrease in Supply
Increase in Supply
An increase in supply takes place when a supplier is willing to offer large quantities of products in the market at the same price due to various reasons, such as improvement in production techniques, fall in prices of factors of production, and reduction in taxes.
Decrease in Supply
A decrease in supply occurs when a supplier is willing to offer small quantities of products in the market at the same price due to increase in taxes, low agricultural production, high costs of labour, unfavourable weather conditions, etc.
Supply curve shifts
A shift takes place in supply curve due to the increase or decrease in supply, which is shown in Figure.
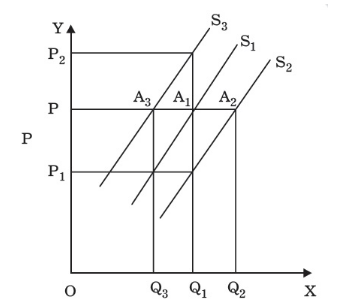
In the above Figure, an increase in supply in indicated by the shift of the supply curve from S1 to S2. Because of an increase in supply, there is a shift at the given price OP, from A1 on supply curve S1 to A2 on supply curve S2. At this point, large quantities (i.e. Q2 instead of Q1) are offered at the given price OP.
On the contrary, there is a shift in supply curve from S1 to S3 when there is a decrease in supply. The amount supplied at OP is decreased from OQ1 to OQ3 due to a shift from A1 on supply curve S1 to A3 on supply curve S3.
However, a decrease in supply also occurs when producers sell the same quantity at a higher price which is shown in Figure as OQ1 is supplied at a higher price OP2.
Q14) What are the effects of changes in Demand on equilibrium? 5 marks
A14)
The market price where the quantity of goods supplied is equal to the quantity of goods demanded is called as equilibrium price. This is the point at which the market demand and market supply curves intersects. Whenever there are changes in demand and supply, position of equilibrium will change.
Effects of Changes in Demand on Equilibrium
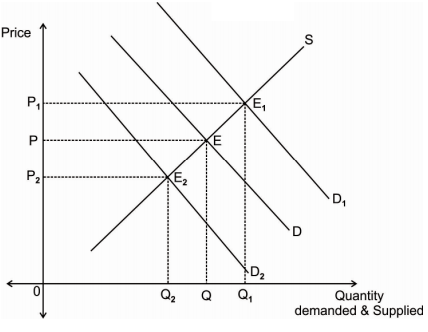
In the above diagram D is the original demand curve and S is the original Supply curve. At equilibrium E, equilibrium price is P and equilibrium quantity demanded and supplied is OQ. If there are favourable changes in the non-price factors affecting demand then the demand curve will shift outward and become D1. Now the new equilibrium is at E1. At E1, equilibrium price is P1 and equilibrium quantity demanded and supplied is OQ1. If there are unfavourable changes in the non-price factors affecting demand then the demand curve will shift inward and become D2. Now the new equilibrium is at E2. At E2, equilibrium price is P2 and equilibrium quantity demanded and supplied is OQ2. Thus increase in demand leads to higher price and decrease in demand leads to lower prices.
Q15) What are the effects of changes in Supply on equilibrium? 5 marks
A15)
The market price where the quantity of goods supplied is equal to the quantity of goods demanded is called as equilibrium price. This is the point at which the market demand and market supply curves intersects. Whenever there are changes in demand and supply, position of equilibrium will change.
Effects of Changes in supply on Equilibrium
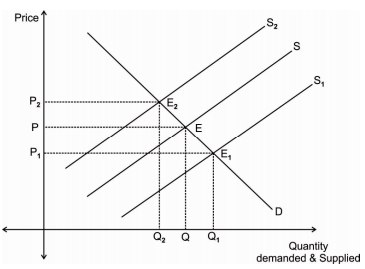
In the above diagram D is the original demand curve and S is the original Supply curve. At equilibrium E, equilibrium price is P and equilibrium quantity demanded and supplied is OQ. If there are favourable changes in the non-price factors affecting supply then the supply curve will shift outward and become S1. Now the new equilibrium is at E1. At E1, equilibrium price is P1 and equilibrium quantity demanded and supplied is OQ1. If there are unfavourable changes in the non-price factors affecting supply then the supply curve will shift inward and become S2. Now the new equilibrium is at E2. At E2, equilibrium price is P2 and equilibrium quantity demanded and supplied is OQ2. Thus increase in supply leads to lower price and decrease in supply leads to higher prices.
Q16) Explain the scope of business economics and relationship between Total, Average and Marginal? 12 marks
A16)
Business Economics, also called Managerial Economics, is the application of economic theory and methodology to business. Business involves decision-making. Decision making means the process of selecting one out of two or more alternative courses of action. The question of choice arises because the basic resources such as capital, land, labour and management are limited and can be employed in alternative uses. The decision-making function thus becomes one of making choice and taking decisions that will provide the most efficient means of attaining a desired end, say, profit maximation.
Definition
According to Mc Nair and Meriam, “Business economic consists of the use of economic modes of thought to analyse business situations.”
According to Mansfield, “business economics is concerned with the application of economic concepts and economic analysis to the problem of formulating rational decision making”.
Nature of business economics
- Microeconomics - Business economics is microeconomic in character. This is because it studies the problems of an individual business unit. It does not study the problems of the entire economy.
- Normative science - Managerial economics is a normative science. Under particular circumstances it is concerned with what management should do. It determines the goals of the enterprise. Then it develops the ways to achieve these goals.
- Pragmatic - Business economics is pragmatic. It concentrates on making economic theory more application-oriented. It tries to solve the managerial problems in their day-to-day functioning.
- Prescriptive - Managerial economics is prescriptive rather than descriptive. It prescribes solutions to various business problems.
- Uses macroeconomics - Macroeconomics is also useful to business economics. Macro-economics provides an intelligent understanding of the environment in which the business operates.
- Management oriented - The main aim of managerial economics is to help the management in taking correct decisions and preparing plans and policies for the future.
Scope of business economics
- Demand Analysis and Forecasting: A business firm is an economic organisation which transform productive resources into goods to be sold in the market. A major part of business decision making depends on accurate estimates of demand. A demand forecast can serve as a guide to management for maintaining and strengthening market position and enlarging profits. Demands analysis helps identify the various factors influencing the product demand and thus provides guidelines for manipulating demand.
- Cost and Production Analysis: A study of economic costs, combined with the data drawn from the firm’s accounting records, can yield significant cost estimates which are useful for management decisions. An element of cost uncertainty exists because all the factors determining costs are not known and controllable. Discovering economic costs and the ability to measure them are the necessary steps for more effective profit planning, cost control and sound pricing practices. Production analysis is narrower, in scope than cost analysis. Production analysis frequently proceeds in physical terms while cost analysis proceeds in monetary terms.
- Pricing Decisions, Policies and Practices: Pricing is an important area of business economic. In fact, price is the genesis of a firms revenue and as such its success largely depends on how correctly the pricing decisions are taken. The important aspects dealt with under pricing include. Price Determination in Various Market Forms, Pricing Method, Differential Pricing, Product-line Pricing and Price Forecasting.
- Profit Management: Business firms are generally organised for purpose of making profits and in the long run profits earned are taken as an important measure of the firms success. If knowledge about the future were perfect, profit analysis would have been a very easy task. However, in a world of uncertainty, expectations are not always realised so that profit planning and measurement constitute a difficult area of business economic.
- Capital Management: Among the various types business problems, the most complex and troublesome for the business manager are those relating to a firm’s capital investments. Relatively large sums are involved and the problems are so complex that their solution requires considerable time and labour.
Relationship between Total, Average and Marginal
The Relationship between Total, Average and Marginal can be explained with the help of concepts like utility, cost, revenue etc. Here we will take example of revenue concepts.
Where, P = Price & Q = Quantity
TR = Total Revenue
AR = Average Revenue
MR = Marginal Revenue
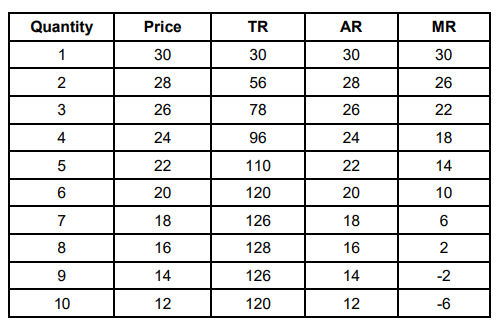
Total revenue is calculated by multiplying price and quantity. As quantity increases TR increases initially then it decreases. AR is same as price. MR decreases constantly and becomes negative eventually.
Important concepts
1. Variables
A variable is magnitude of interest that can be measured. Variables can be endogenous and exogenous variables. Variables can be independent and dependent.
2. Functions
Function shows existence of relationship between two or more variables. It indicates how the value of one variable depends on the value of another one. It does not give any direction of relation.
3. Equations
An equation specifies the relationship between the dependent and independent variables. It specifies the direction of relation.
4. Graph
Graph is a geometric tool used to express the relationship between variables. It is a pictorial representation of data which shows how two or more sets of data or variables are related to one another.
5. Curves
The functional relationship between the variables specified in the form of equations can be shown by drawing line or outline which gradually deviates from being straight for some or all of its length in the graph.
6. Slopes
Slopes show how fast or at what rate, the dependant variable is changing in response to a change in the independent variable.
Q17) Explain market demand and supply? 5 marks
A17)
Market Demand
Individual demand for a product is based on an individual’s choice / Preference among different products, price of the product, income etc. Individual demand is nothing but desire backed by individual’s ability and willingness to pay. By summing up the demand of all the consumers or individuals for the product we get market demand for that particular product.
Market demand schedule
Price | Demand of Individual A | Demand of Individual A | Market Demand (Demand of Individual A + Demand of Individual B) |
10 | 5 | 7 | 12 |
20 | 4 | 6 | 10 |
30 | 3 | 5 | 8 |
40 | 2 | 4 | 6 |
50 | 1 | 3 | 4 |
The above table represents demand schedule of individual A, individual B and Market Demand. Same schedule can be represented with the help of a graph.
Market demand curve
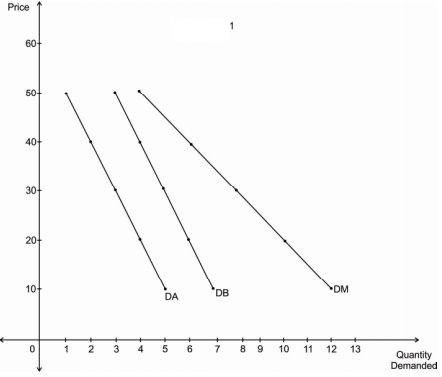
Diagram represents demand curve of individual A, individual B and Market Demand. DA is a demand curve of individual A. DB is the demand curve of individual B. DM is the market demand curve. All curves are downward sloping indicating negative relationship between price and quantity demanded.
Market supply
Individual Supply is the amount of a product that producer is willing to sell at given prices. By summing up the supply of all the producers for the product we get market supply for that particular product.
Market supply schedule
Price | Supply of Producer A | Supply of Producer B | Market Supply (Supply of Producer A + Supply of Producer B) |
10 | 1 | 3 | 4 |
20 | 2 | 4 | 6 |
30 | 3 | 5 | 8 |
40 | 4 | 6 | 10 |
50 | 5 | 7 | 12 |
The above table represents supply schedule of producer A, producer B and Market supply. Same schedule can be represented with the help of a graph.
Market Supply Curve
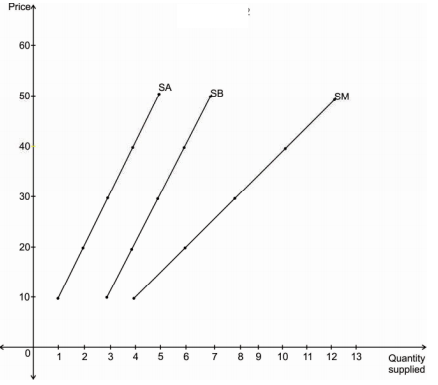
Diagram represents supply curve of producer A, producer B and Market supply. SA is a supply curve of producer A. SB is the supply curve of producer B. SM is the market supply curve. All curves are upward sloping indicating positive relationship between price and quantity demanded.
Q18) Explain shift in demand curve? 12 marks
A18)
Shift in demand curve
The shift in demand curve is when, the price of the commodity remains constant, but there is a change in quantity demanded due to some other factors, causing the curve to shift to a particular side.
Change in demand refers to increase or decrease in demand for a product due to various determinants of demand other than price.
- It is measured by shifts in the demand curve.
- The terms, change in demand means to increase or decrease in demand.
Increase and decrease in demand takes place due to changes in other factors, such as change in income, distribution of income, change in consumer’s tastes and preferences, change in the price of related goods. In this case, the price factor remains unchanged.
Increase in demand
Increase in demand refers to the rise in demand for a product at a specific price,
Decrease in demand
Decrease in demand is the fall in demand for a product at a given price.
When other factors change, the demand curve changes its position which is referred to as a shift along the demand curve, which is shown in Figure.
Demand Curve Shift
Demand curve D2 is the original demand curve of commodity X. At price OP2, the demand is OQ2 units of commodity X.
When the consumer’s income decreases owing to high income tax, he is able to purchase only OQ1 unit of commodity X at the same price OP2. Therefore, the demand curve, D2 shifts downwards to D1.
Similarly, when the consumer’s disposable income increases due to a reduction in taxes, they are able to purchase OQ3 units of commodity X at the price OP2. Therefore, the demand curve, D2 shifts upwards to D3. Such changes in the position of the demand curve from its original position are referred to as a shift in the demand curve.
Shift in supply curve
The shift in supply curve is when, the price of the commodity remains constant, but there is a change in quantity supply due to some other factors, causing the curve to shift to a particular side.
Change in supply refers to increase or decrease in the supply of a product due to various determinants of supply other than price (in this case, price remaining constant).
- It is measured by shifts in supply curve.
- The terms, while a change in supply means an increase or decrease in supply.
Increase and Decrease in Supply
Increase in Supply
An increase in supply takes place when a supplier is willing to offer large quantities of products in the market at the same price due to various reasons, such as improvement in production techniques, fall in prices of factors of production, and reduction in taxes.
Decrease in Supply
A decrease in supply occurs when a supplier is willing to offer small quantities of products in the market at the same price due to increase in taxes, low agricultural production, high costs of labour, unfavourable weather conditions, etc.
Supply curve shifts
A shift takes place in supply curve due to the increase or decrease in supply, which is shown in Figure.
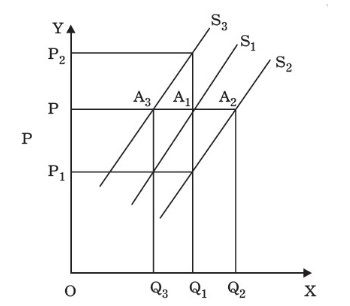
In the above Figure, an increase in supply in indicated by the shift of the supply curve from S1 to S2. Because of an increase in supply, there is a shift at the given price OP, from A1 on supply curve S1 to A2 on supply curve S2. At this point, large quantities (i.e. Q2 instead of Q1) are offered at the given price OP.
On the contrary, there is a shift in supply curve from S1 to S3 when there is a decrease in supply. The amount supplied at OP is decreased from OQ1 to OQ3 due to a shift from A1 on supply curve S1 to A3 on supply curve S3.
However, a decrease in supply also occurs when producers sell the same quantity at a higher price which is shown in Figure as OQ1 is supplied at a higher price OP2.
Q19) Explain Opportunity Cost principle- Incremental and Marginal Concepts.? 12 marks
A19)
Business Economics, also called Managerial Economics, is the application of economic theory and methodology to business. Business involves decision-making. Decision making means the process of selecting one out of two or more alternative courses of action. The question of choice arises because the basic resources such as capital, land, labour and management are limited and can be employed in alternative uses. The decision-making function thus becomes one of making choice and taking decisions that will provide the most efficient means of attaining a desired end, say, profit maximation.
Definition
According to Mc Nair and Meriam, “Business economic consists of the use of economic modes of thought to analyse business situations.”
According to Mansfield, “business economics is concerned with the application of economic concepts and economic analysis to the problem of formulating rational decision making”.
Nature of business economics
- Microeconomics - Business economics is microeconomic in character. This is because it studies the problems of an individual business unit. It does not study the problems of the entire economy.
- Normative science - Managerial economics is a normative science. Under particular circumstances it is concerned with what management should do. It determines the goals of the enterprise. Then it develops the ways to achieve these goals.
- Pragmatic - Business economics is pragmatic. It concentrates on making economic theory more application-oriented. It tries to solve the managerial problems in their day-to-day functioning.
- Prescriptive - Managerial economics is prescriptive rather than descriptive. It prescribes solutions to various business problems.
- Uses macroeconomics - Macroeconomics is also useful to business economics. Macro-economics provides an intelligent understanding of the environment in which the business operates.
- Management oriented - The main aim of managerial economics is to help the management in taking correct decisions and preparing plans and policies for the future.
Basic tools of business economics
Opportunity cost principle
By opportunity cost of a decision is meant the sacrifice of alternatives required by that decision. If there are no sacrifices, there is no cost. According to Opportunity cost principle, a firm can hire a factor of production if and only if that factor earns a reward in that occupation/job equal or greater than it’s opportunity cost. Opportunity cost is the minimum price that would be necessary to retain a factorservice in it’s given use. It is also defined as the cost of sacrificed alternatives. For instance, a person chooses to forgo his present lucrative job which offers him Rs.50000 per month, and organizes his own business. The opportunity lost (earning Rs. 50,000) will be the opportunity cost of running his own business.
Marginal and incremental principle
Marginalism
Rational decision makers will always think in terms of marginal quantities. One should compare the cost of an additional chocolate with the benefits of an extra chocolate in order to decide whether to have it or not. If the additional revenue that the producer is going to get by producing one more car is greater than the cost of producing the extra car, only then the seller will produce an extra car.
Let us take one example, an additional car sells for Rs. 10 lacks while it costs only Rs. 8 lakhs to produce the additional car. Clearly, a rational producer will decide to produce the car because he will make profit of Rs. 2 lakhs per car. On the other hand, if the price of car falls to Rs.7 lakhs while the cost of producing it remains Rs. 8 lakh, it will not make sense to produce the additional car since the cost surpasses the revenue to be earned from it. The cost of producing the extra car is called as marginal cost while the revenue obtained from selling an extra car is called as marginal revenue. If marginal revenue exceeds marginal cost, it obviously makes sense to produce the extra car. If the marginal revenue is less than marginal cost, it not advisable to produce the extra car.
Let us take another example from your day to day life. Suppose you may score 10 additional marks in economics by studying for entire night. Getting the additional 10 marks is important because it makes you feel happy and proud. But suppose staying up for entire night makes you feel really sleepy in the morning hence makes you feel dull and unhappy. In this case, whether you should study for entire night depends upon whether the happiness that you get from the 10 additional marks in economics overshadows the unhappiness caused by the additional sleeplessness. In this way individuals can make use of marginalism principal in their day to day life for making appropriate decisions.
Incrementalism
Marginalism represents small unit change in the concerned variables. But many times in real life situations changes takes place in chunks or batches. For example firm producing car will not generally increase its production by one unit, but by a batch of additional units. Here we use concept of incrementalism instead of marginalism and decision will be taken by comparing incremental cost and incremental revenue.