Unit 2
Demand Analysis
Q1) Explain the law of demand and the factors with determines the demand? (8 marks)
A1)
Ordinarily, DEMAND means a desire or want for something. In economics, however, demand means much more than that. Economics attach a special meaning to the concept of demand i.e. ‘Demand is the desire or want backed up by money.’ It means effective desire or want for a commodity, which is backed up the purchasing power and willingness to pay for it.
Demand, in economics, means effective demand for a commodity. It requires three conditions on the part of consumer.
- Desire for a commodity.
- Capacity to buy or purchased.
- Willingness to pay its price.
 In short,
Demand = Desire + Ability to pay + Willingness to spend
Demand is always related to Price & Time. Demand is not the absolute term. It is a relative concept. Demand for a commodity should always have a reference to Price & Time.
 For e.g. – Price Grapes for house hold at a price of Rs. 20/- per Kg., Rs. 10/- per Kg
 Time per day, per month, per year
Definition:
The Demand for a commodity refers to the quantity of a commodity that a person is willing to buy at different prices during period of time.
Determinants of demand
- Price of commodity (Px): The price of commodity is very important determinants of demand for any commodity. Other things remaining same, the rise in price of the commodity, the demand for the commodity contracts, and with the fall in price, its demand expands. So, the quantity demanded and price shows an inverse relationship in the case of normal goods. In other word changes in price brings changes in the consumer’s demand for that commodity.
2. Income (Y): Another important determinant of demand for a commodity is consumer’s income. Change in consumer’s income also influences the change in consumer’s demand for a commodities. The demand for normal goods increases with the increasing level of income and vice versa. It shows a direct relationship between income and quantity demanded.
3. Price of related commodities (Py):The demand for a commodity is also affected by the price of other commodities, especially of substitute or complementary goods. A good may have some related goods either substitute or complementary. The relation between two may be different.
- Substitute Goods: Substitute Goods are those goods which can be substituted from each other. For Instance Tea & Coffee. When the rise in the price of Tea causes rise in demand for Coffee because there is no change in price of coffee such goods are called as substitute goods. In other words the relation between two substitute goods are positive. An incase the price of one commodity increase the demand for other.
- Complementary Goods: Complementary goods are those goods which one purchased together. For Instance Car & Petrol. When their a rise in price of Petrol leads to fall in demand for Car such goods are called complementary good. In other words, the relation between two complementary goods are negative. An increase in price of one commodity leads to decrease in demand for other.
4. Taste and Preference (T): The demand for a commodity also depends on the consumer’s taste and preferences such as change in fashion, culture, tradition etc. As the consumers taste and preference for a particular commodity changes the demand for that particular commodity also changes. Therefore, Taste and Preference of a consumer plays an important role.
5. Advertising expenditure (A): Advertising expenditure by a firm influence the demand for a commodity. The advertisements by the manufacturer and sellers attract more customers towards the commodity. There exists positive relationship between advertising expenditure and demand for the commodity
6. Size and Composition of population: Demand for goods depends also on the size of population. Larger the number of people larger will be the demand for goods. Age composition also influences the demand for the goods. For e.g. – A larger number of children in the country will increase the demand for baby food and toys.
7. Future expectation: Demand for goods depends also on consumer’s expectation about the future changes. They may include expectations about changes in price, income, prices of related goods, availability of goods and so on. For e.g. – If consumers expect prices of essential goods to rise they will buy more of them now. On the other hand, expectation of decline in price will reduce the present demand.
8. Availability of credits: Demand for expensive and durable goods depends also an availability of credit. Greater the availability of credit, larger will be the demand. For e.g. – Availability of Loans for buying houses, cars, motorcycles etc. has influenced the demand for these goods.
9. Climatic condition: Demand for certain goods is also influenced by whether or climatic conditions. For e.g. Demand for umbrellas, woolen clothes etc. are seasonal in nature.
10. Social factors: Demand for goods is also influenced by social customs, traditions and practices. For e.g. – during Diwali there is greater demand for sweets and crackers.
Law of demand
The law of demand states that all other factors remain constant or equal, an increase in the price causes a decrease in the quantity demanded and a decrease in goods or services price leads to increase in the quantity demanded. Thus it expresses an inverse relationship between price and demand.
For example, at Rs 70 per kg consumer may demand 2 kg of apple. On the other hand, the price rises to 100/- per kg then he may demand 1 kg of apple
Assumption of law of demand
- No change in the income.
- No change in size population.
- No change in price of related goods.
- No change in consumers taste, preferences, etc.
- No expectation of a price change in future.
- No change in climate conditions.
Given these assumption, the law of demand is explained in the below table –
Price(rs) | Quantity demanded |
10 | 10 |
8 | 20 |
6 | 30 |
4 | 40 |
2 | 50 |
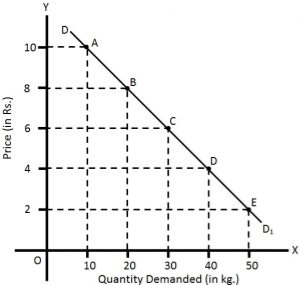
The above table shows that when the price of apple, is Rs. 10 per kg, 10 kg are demanded. If the price falls to Rs.8, the demand increases to 20 kg. Similarly, when the price declines to Rs 2, the demand increases to 50 kg. This indicates the inverse relation between price and demand.
Also, in the above figure the demand curve slopes downwards as the price decreases, the quantity demanded increases.
Exception of law of demand
Under the following circumstances, consumers buy more when the price of a commodity rises, and less when price falls which leads to upward sloping demand curve.
- Giffen goods are those products where the demand increases with the increase in price. For example, necessities products like rice, wheat. Lower incomes group will spend less on superior foods (like meat) to buy more rice, wheat etc.
- In anticipation of war, consumers start buying even when the prices are high due to the fear of shortage.
- During a depression, the prices of products are low still the demand for those products is also less.
- The law of demand is not applicable on necessities of life such as food, cloth etc
Q2) Explain the nature of demand curve under different markets.? (8 marks)
A2)
Economist have classified the various markets prevailing in a capitalist economy into (a) perfect competition or pure competition, (b) monopolistic competition, (c) oligopoly and (d) monopoly. According to Cournot, a French economist, “Economist understand by the term market not any particular market place in which things are bought and sold but the whole of any region in which buyers and sellers are in such free interaction with one another that the price of the same good tends to equality easily and quickly’’. The type of different market depends on number of factors. Accordingly, the nature of demand curve is different in different market. The nature of demand curve under various market structure are as follows:
Demand Curve in Perfect Competition:
Perfect competition is said to prevail when there are large number of producers (firms) producing and selling homogenous product. The maximum output produce by the individual firm is very small relatively to the total demand to the industry product so that firm cannot affect the price by varying its supply of output. The seller is the price taker he accepts the price determined in the market by market demand and market supply. Thus, the individual price under perfect competition is determine by the market demand and market supply.
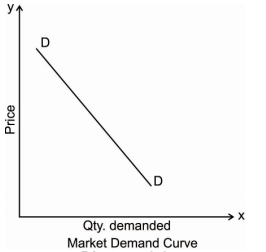
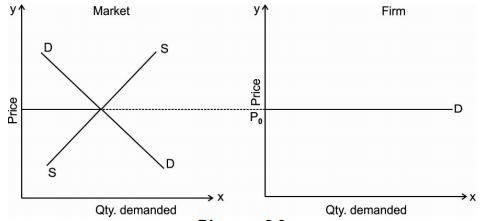
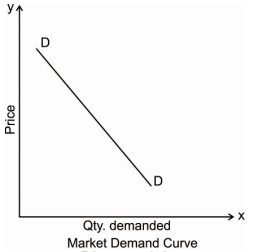
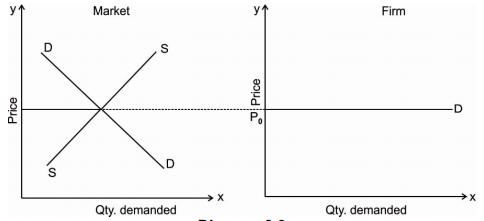
Market Demand Curve: The market demand curve under perfect competition is downward sloping. Because price and quantity demand are inversely related to each other as the price of a commodity increases the demand for that good decreases. The market price at which the firms will sell their commodity is determined by the interaction of market demand and market supply. Once the market determines the price for the commodity all firms will fix their price equals to market price as they are price taker under the perfect competition. Thus, the individual demand curve is equal to the equilibrium price of the market. The Diagram below shows the market demand curve which is downward sloping and P0 is the equilibrium market price which is followed by all the individual firm and the individual firm is facing the horizontal demand curve.
Individual Firm demand curve: Demand curve facing an individual firm working under prefect competition is perfectly elastic i.e. a horizontal straight line parallel to X axis at a given price which is determined by the market demand sand market supply. The Diagram below shows Qty demanded on X axis and Price of the commodity on Y axis. Where OP1 is the price determined by the interaction of market demand and market supply curve. It shows if firm tries to lower the price, he will get negative profit.
Demand Curve under Monopoly:
Monopoly is a market where there is single firm producing and selling product which has no close substitute. As being the single seller monopoly has a control on supply and he can also decide the price of a commodity. But however, a rational monopolist who aim at maximum profit will control either price or supply. As monopolists is the only single seller in the market, he constitutes the whole industry. Therefore, the demand curve under monopoly market is downward sloping and has a steeper slope as shown in the Diagram below:
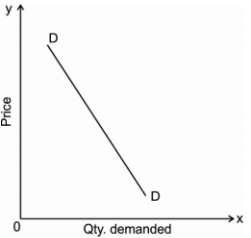
Thus, in monopoly there is a strong barrier to entry new firm in the industry. If the monopolist firm wants to increases the sale in the market, he has to lower the price of its commodity.
Demand curve under Monopolistic competition: In the monopolistic market there is a large number of firms producing or selling somewhat differentiated product which have close substitute. As a result, demand curve facing a firm under monopolistic competition is sloping downward and has a flatter shape which is highly elastic and this indicate that a firm enjoy some control over the price of a commodity. The demand curve facing an individual firm under monopolistic competition is shown in the following Diagram.
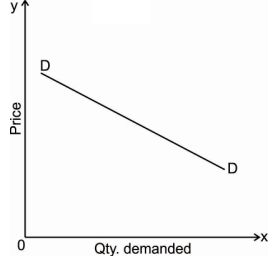
Demand curve under oligopoly market : Oligopoly is a market where there are few firms or sellers producing or selling differentiated products. The fewness of firm ensures that each of them will have some control over the price of the product and the demand curve facing each other will be downward sloping which indicates the price elasticity of demand for each firm will not be infinite. As there are interdependence of firm. Any decision regarding change in the price of output attracts reaction from the rival firms. Therefore, the demand curve for an oligopoly firm is indeterminate, i.e. it cannot be drawn accurately as exact behaviour pattern of a producer with certainty.
The demand curve faced by the firm under oligopoly is shown in the following Diagram
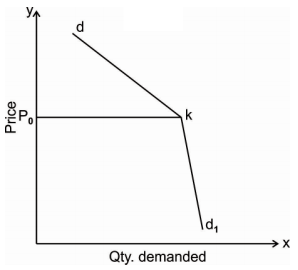
The demand curve facing an oligopolist is kinked in nature. The kink is formed at a prevailing level the point K because the segment of the demand curve above the prevailing price level i.e. Kd is highly elastic and the segment the segment below the prevailing price level i.e. Kd1 is inelastic. This is due to different reaction of the different firm.
Q3) What is demand function? Explain in detail. (8 marks)
A3)
Demand function is an arithmetic expression that shows the functional relationship between the demand for a commodity and therefore the various factors affecting it. This includes the income of a consumer and therefore the price of a commodity along side other various determining factors affecting demand. The demand for a commodity is that the dependent variable, while its determinants factors are the independent variables.
The demand for a commodity depends on various factors which determines the quantity of a commodity demanded by various individuals or a bunch of people . The subsequent equation shows the demand function which expresses the connection between the number demanded of a commodity X and its determinants.

Where,
Qdx = Quantity demanded of commodity X.
Px = Price of commodity X.
Y = income of a consumer.
Py = Price of related commodities.
T = Taste and Preference of a consumer.
A= Adverting expenditure made by producer.
Meaning of demand
Ordinarily, DEMAND means a desire or want for something. In economics, however, demand means much more than that. Economics attach a special meaning to the concept of demand i.e. ‘Demand is the desire or want backed up by money.’ It means effective desire or want for a commodity, which is backed up the purchasing power and willingness to pay for it.
Demand, in economics, means effective demand for a commodity. It requires three conditions on the part of consumer.
- Desire for a commodity.
- Capacity to buy or purchased.
- Willingness to pay its price.
 In short,
Demand = Desire + Ability to pay + Willingness to spend
Demand is always related to Price & Time. Demand is not the absolute term. It is a relative concept. Demand for a commodity should always have a reference to Price & Time.
 For e.g. – Price Grapes for house hold at a price of Rs. 20/- per Kg., Rs. 10/- per Kg
 Time per day, per month, per year
Definition:
The Demand for a commodity refers to the quantity of a commodity that a person is willing to buy at different prices during period of time.
Determinants of demand
- Price of commodity (Px): The price of commodity is very important determinants of demand for any commodity. Other things remaining same, the rise in price of the commodity, the demand for the commodity contracts, and with the fall in price, its demand expands. So, the quantity demanded and price shows an inverse relationship in the case of normal goods. In other word changes in price brings changes in the consumer’s demand for that commodity.
2. Income (Y): Another important determinant of demand for a commodity is consumer’s income. Change in consumer’s income also influences the change in consumer’s demand for a commodities. The demand for normal goods increases with the increasing level of income and vice versa. It shows a direct relationship between income and quantity demanded.
3. Price of related commodities (Py): The demand for a commodity is also affected by the price of other commodities, especially of substitute or complementary goods. A good may have some related goods either substitute or complementary. The relation between two may be different.
- Substitute Goods: Substitute Goods are those goods which can be substituted from each other. For Instance Tea & Coffee. When the rise in the price of Tea causes rise in demand for Coffee because there is no change in price of coffee such goods are called as substitute goods. In other words the relation between two substitute goods are positive. An incase the price of one commodity increase the demand for other.
- Complementary Goods: Complementary goods are those goods which one purchased together. For Instance Car & Petrol. When their a rise in price of Petrol leads to fall in demand for Car such goods are called complementary good. In other words, the relation between two complementary goods are negative. An increase in price of one commodity leads to decrease in demand for other.
4. Taste and Preference (T): The demand for a commodity also depends on the consumer’s taste and preferences such as change in fashion, culture, tradition etc. As the consumers taste and preference for a particular commodity changes the demand for that particular commodity also changes. Therefore, Taste and Preference of a consumer plays an important role.
5. Advertising expenditure (A): Advertising expenditure by a firm influence the demand for a commodity. The advertisements by the manufacturer and sellers attract more customers towards the commodity. There exists positive relationship between advertising expenditure and demand for the commodity
6. Size and Composition of population: Demand for goods depends also on the size of population. Larger the number of people larger will be the demand for goods. Age composition also influences the demand for the goods. For e.g. – A larger number of children in the country will increase the demand for baby food and toys.
7. Future expectation: Demand for goods depends also on consumer’s expectation about the future changes. They may include expectations about changes in price, income, prices of related goods, availability of goods and so on. For e.g. – If consumers expect prices of essential goods to rise they will buy more of them now. On the other hand, expectation of decline in price will reduce the present demand.
8. Availability of credits: Demand for expensive and durable goods depends also an availability of credit. Greater the availability of credit, larger will be the demand. For e.g. – Availability of Loans for buying houses, cars, motorcycles etc. has influenced the demand for these goods.
9. Climatic condition: Demand for certain goods is also influenced by whether or climatic conditions. For e.g. Demand for umbrellas, woolen clothes etc. are seasonal in nature.
10. Social factors: Demand for goods is also influenced by social customs, traditions and practices. For e.g. – during Diwali there is greater demand for sweets and crackers.
Q4) What is elasticity? Explain price elasticity of demand in detail. (8 marks)
A4)
Elasticity of demand
Under law of demand, price falls and demand rises, vice versa. But how much the quantity rise or fall for a given change in price is not determined in law of demand. So the concept of elasticity of demand is derived to know how much quantity demanded changes for a change in the price of goods or services.
“The elasticity (or responsiveness) of demand in a market is great or small according as the amount demanded increases much or little for a given fall in price, and diminishes much or little for a given rise in price”. – Dr. Marshall.
Elasticity means sensitivity of demand to the change in price.
The formula for calculating elasticity of demand is:
EP = proportional changes in quantity demanded/proportional changes in price
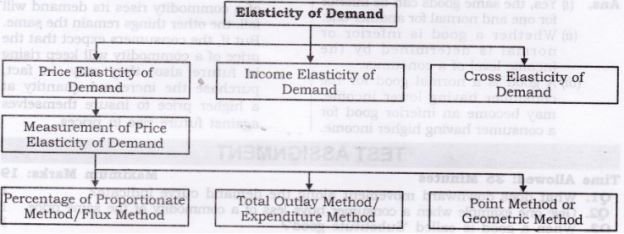
Price elasticity of demand
The price of elasticity demand is the change in the quantity demanded to the change in the price of the commodity
Dr Marshall has defined price elasticity of demand as below:
"Price elasticity of demand is a ratio of proportionate changes in the quantity demanded of a commodity to a given proportionate change in its price."
Thus, pride elasticity is responsiveness of change in demand due to a change in price only. Other factors such as income, population, tastes, habits, fashions, prices of substitute and complementary goods are assumed to be constant.
Formula –
Ep = percentage change in quantity demanded/percentage change in price
Types
There are 5 types of price elasticity of demand given below
- Perfectly elastic demand
a) A small change in price results to major change in demand is said to be perfectly elastic demand
b) The demand curve in perfectly elastic demand represent horizontal straight line
c) Ep = infinity 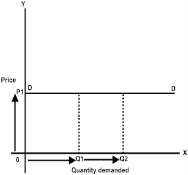
From the above figure, we can see at price P1 consumers are ready to buy as much quantity as they want. A slight increase in price may result to fall in demand to zero.
2. Perfectly inelastic demand
a) When there is no change in the demand of the commodity with the change in price is said to be perfectly inelastic demand
b) The demand curve in perfectly elastic demand represent Vertical straight line
c) Ep = zero
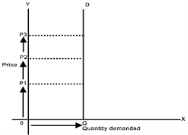


From the above fig, we can see that price is rising from P1 to P2 to P3, but there is no change in the demand. This cannot happen in practical situation. But, in essential goods such as salt, with the change in price the demand does not change.
3. Relatively elastic demand
a) When the proportionate change in demand is greater than the proportionate change in price of a product
b) The value ranges between one to infinity (ep>1)
c) Ex – a smaller change in flight price result in more demand for booking the flight tickets
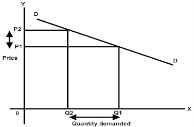

- From the above figure, it is observed that the percentage change in demand from Q2 to Q1 is larger than the percentage change in price from P2 to P1. Thus the demand curve is gradually sloping downwards
4. Relatively inelastic demand
a) When the percentage change in demand is less than the percentage change in price
b) The value ranges between zero to one (ep<1)
c) Ex – cloths, drinks, food, oil , as the change in price does not affect the quantity demanded.

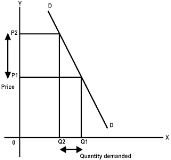
d) From the above figure, it is interpreted that the proportionate change in demand from Q2 to Q1 is less than the proportionate change in price from P2 to P1. Thus the demand cure rapidly sloping down.
5. Unitary elastic demand
a) When the percentage change in quantity demanded in equal to the percentage change in price of the commodity
b) The value is equal to one (ep=1)
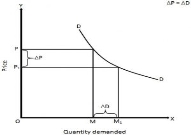
In the above figure we can observe that proportionate change in price from P to P1 cause the same proportionate change in price from M to M1
Q5) Explain the measurements of price elasticity of demand. (5 marks)
A5)
Price elasticity of demand
The price of elasticity demand is the change in the quantity demanded to the change in the price of the commodity
Dr Marshall has defined price elasticity of demand as below:
"Price elasticity of demand is a ratio of proportionate changes in the quantity demanded of a commodity to a given proportionate change in its price."
Thus, pride elasticity is responsiveness of change in demand due to a change in price only. Other factors such as income, population, tastes, habits, fashions, prices of substitute and complementary goods are assumed to be constant.
Formula –
Ep = percentage change in quantity demanded/percentage change in price
Measurements
1. Ratio or Proportional Method
This ratio method of measuring elasticity of demand is also known as Arithmetic or Percentage method. This method is developed by Dr. Marshall. In this method percentage change in quantity demanded and divide it by percentage change in the price of the commodity.
Example
Price of X | Demand (Units) |
200 | 1000 |
100 | 1500 |
In the above table we can see the price of commodity X falls from Rs. 200/- to Rs. 100/- and quantity demanded increases from 1000 units to 1500 units. Here percentage change in demand is 50, whereas percentage change in price is also 50. Therefore, 50%, / 50% = 1, which, means Ed is unitary or one.
2. Total expenditure method - In this method, statistics of total expenditure is used to find out elasticity of demand. Total expenditure at the original price and total expenditure at the new price is compared with each other, and we come to know the elasticity of demand.
When price falls or rises, total expenditure does not change or remains constant, demand is unitary elastic.
When price falls, total expenditure increases or price rises and total expenditure decreases, demand is elastic or elasticity of demand is greater than one.
Example
Price (Rs.) | Demand (Units) | Total Outlay (Rs.) | Elasticity of Demand | |
A | 10 8 | 12 15 | 120 120 | Unitary or 1 |
B | 10 8 | 12 20 | 120 160 | Elastic or > 1 |
C | 10 8 | 12 14 | 120 112 | Inelastic or < 2 |
3. Point elasticity method – the price elasticity of demand also be measured at any point on the demand curve. It is noted that demand is unitary at mid point of demand curve that total revenue is maximum at this point. Any point above unitary point shows elasticity is greater than one (means price relation in this point leads to an increase in the total revenue.
Any point below mid point shows elasticity is less than one means price relation in these point lead to reduction in the total revenue.
Q6) What are the factors affecting price elasticity of demand? (5 marks)
A6)
The price of elasticity demand is the change in the quantity demanded to the change in the price of the commodity
Dr Marshall has defined price elasticity of demand as below:
"Price elasticity of demand is a ratio of proportionate changes in the quantity demanded of a commodity to a given proportionate change in its price."
Thus, pride elasticity is responsiveness of change in demand due to a change in price only. Other factors such as income, population, tastes, habits, fashions, prices of substitute and complementary goods are assumed to be constant.
Formula –
Ep = percentage change in quantity demanded/percentage change in price
The price elasticity of demand depends upon number of factors which affects its elasticity. They are as follows:
- Nature of goods or commodity: The elasticity of demand for a commodity depends upon the nature of the commodity, i.e., whether the commodity is a necessary, comfort or luxury good. The elasticity of demand for a necessary commodity is relatively small. For example, if the price of such a good rise, its buyers generally are not able to reduce its demand as its necessity commodity.
- Availability of Substitute Goods: The price elasticity of demand also depends upon the substitution of goods. If there is a close substitute for a particular commodity in the market, then the demand for such commodity would be relatively more elastic. For example, since tea and coffee are close substitute for each other in the commodity market, a rise in the price of coffee will result in a considerable fall in its demand and a consequent rise in the demand for tea. Therefore, a demand for coffee will be relatively more elastic because of the availability of tea in the market.
- Alternative and Variety of Uses of the Product: as we know that the resources have an alternative use. The demand for such goods has many uses. The more the alternative and variety of uses of a good, the more would be its elasticity of demand. For example, Electricity is used for many purposes such as lighting, heating, cooking, ironing and also use as a source of power in many industries & households. That is why when the price of electricity increases, its demand will decrease and vice versa.
- Role of Habits and custom: if the consumer has a habit of something, he will not reduce his consumption even if the price of such commodity increases the demand for them do not decreases considerably and so their elasticity of demand will be inelastic. Ex; Alcohol, Cigarettes which are injurious for health but people still consume it because of their habit.
- Income Level of the consumer: The elasticity of demand differs due to the change in the income level of the households. Elasticity of demand for a commodity is low for higher income level groups then the people with low incomes. This is because rich people are not influenced much by changes in the price of goods. Poor people are highly affected by the increase or decrease in the price of goods. As a result, demand for the lower income group is highly elastic in demand.
- Postponement of Consumption: if the consumer postponed the consumption of commodity in future the demand is relatively elastic. For example, commodities whose demand is not urgent, have highly elastic demand as their consumption can be postponed if there is an increase in their prices. However, commodities with urgent demand like medicines have inelastic demand because it is an essential commodity whose consumption cannot be post pended.
- Time Period: Price elasticity of demand is related to a period of time. The elasticity of demand varies directly with the time period. In the short run the demand is generally inelastic and in long-run it becomes relatively elastic. This is because consumers find it difficult to change their habits, in the short run, in order to response to the change in the price of the commodity. However, demand is more elastic in long run as their other substitutes available in the market, if the price of the given commodity rises.
Q7) Write a note on: a) Income elasticity of demand. b) Cross elasticity of demand. c) Promotional elasticity of demand. (8 marks)
A7)
Income elasticity of demand
The income elasticity is measures the sensitivity of quantity demanded for a goods or services to a change in consumer’s income.
 Formula - Percentage change in the quantity demanded
Percentage change in the consumer’s income
Types
- Positive income elasticity of demand -
When a proportionate change in the income of a consumer increases the demand for a product and vice versa, income elasticity of demand is said to be positive. In case of normal goods, the income elasticity of demand is generally found positive.
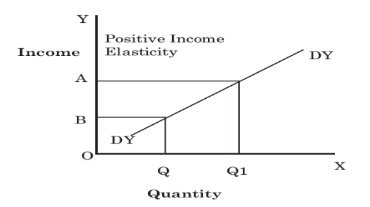
In Figure, DYDY is the curve representing positive income elasticity of demand. The curve is sloping upwards from left to the right, which shows an increase in demand (OQ to OQ1) as a result of rise in income (OB to OA).
2. Negative income elasticity of demand –
When a proportionate change in the income of a consumer results in a fall in the demand for a product and vice versa, income elasticity of demand is said to be negative. In case of inferior goods, the income elasticity of demand is generally found negative.
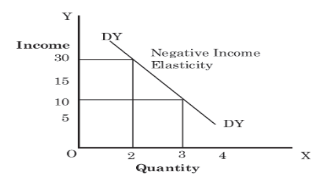
In Figure, DYDY is the curve representing negative income elasticity of demand. The curve is sloping downwards from left to the right, which shows a decrease in the demand as a result of a rise in income. As shown in Figure, with a rise in income from 10 to 30, the demand falls from 3 to 2.
3. Zero income elasticity of demand –
When a proportionate change in the income of a consumer does not bring any change in the demand for a product, income elasticity of demand is said to be zero. It generally occurs for utility goods such as salt, kerosene, electricity.
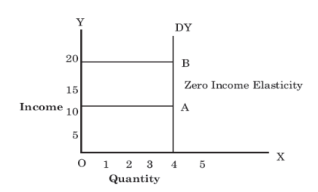
In Figure, DYDY is the curve representing zero income elasticity of demand. The curve is parallel to Y-axis that shows no change in the demand as a result of a rise in income. As shown in Figure, with a rise of income from 10 to 20, the demand remains the same i.e. 4.
Cross elasticity of demand
“The cross elasticity of demand is the proportional change in the quantity of X good demanded resulting from a given relative change in the price of a related good Y” Ferguson
It measures the percentage change in the quantity demanded of commodity X to the percentage change in the price of its substitute/complement Y
 Formula – Proportionate change in quantity demanded of X
Proportionate change in the price of Y
Types
- Positive - When goods are substitute of each other then cross elasticity of demand is positive. In other words, when an increase in the price of Y leads to an increase in the demand of X. For instance, with the increase in price of tea, demand of coffee will increase.
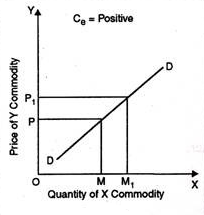
In the above figure, at price OP of Y-commodity, demand of X-commodity is OM. Now as price of Y commodity increases to OP1 demand of X-commodity increases to OM1 Thus, cross elasticity of demand is positive.
2. Negative - A proportionate increase in price of one commodity leads to a proportionate fall in the demand of another commodity because both are demanded jointly refers to negative cross elasticity of demand.
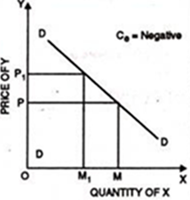
When the price of commodity increases from OP to OP1 quantity demanded falls from OM to OM1. Thus, cross elasticity of demand is negative.
3. Zero - Cross elasticity of demand is zero when two goods are not related to each other. For instance, increase in price of car does not effect the demand of cloth. Thus, cross elasticity of demand is zero.
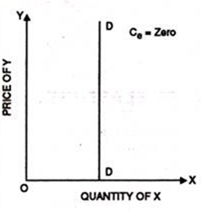
Promotional elasticity of demand
It is also referred to as ‘Advertisement elasticity’. In modern times a rise in expenditure on advertisement or promotion elasticity of demand is that the proportional change in quantity demand due to proportionate change in promotional expenditure. In other words, percentage change in the quantity of demand for a commodity divided by the percentage change in promotional expenditure shows the promotional elasticity of demand.
EA = Percentage change in quantity demanded/ Percentage change in advertisement expenditure
The greater the elasticity of demand, it’s better for a firm to spend more on promotional activities. The promotional elasticity of demand is typically positive.
Q8) Explain the concepts of revenue in detail. (5 marks)
A8)
The term revenue refers to income obtained by the firm through sale of goods and services at different prices
Definition
In the words of Dooley, ‘the revenue of a firm is its sales, receipts or income’.
Revenue are of 3 types as given below

- Total Revenue
a) Income received by the seller after selling the output is called total revenue
b) “Total revenue is the sum of all sales, receipts or income of a firm.” Dooley
c) TR = Q x P
Where,
TR – Total Revenue
Q – Quantity of sale (units sold)
P – Price per unit of output
2. Average Revenue
a) Refers to revenue earned by the seller be selling the per unit of commodity
b) “The average revenue curve shows that the price of the firm’s product is the same at each level of output.” Stonier and Hague
c) AR=TR/Q
Where, AR – Average Revenue, TR – Total Revenue – Total units sold
3. Marginal revenue
a) Marginal revenue is the net revenue the firm receives by selling an additional unit of the commodity.
b) “Marginal revenue is the change in total revenue which results from the sale of one more or one less unit of output.” Ferguson.
c) MR=Change in TR/ change in unit sold
Q9) What is demand forecasting? Explain its importance. (5 marks)
A9)
Demand forecasting means estimation of demand for the product for a future period. Demand forecasting enables an organization to take various decisions in business, such as planning about production process, purchasing of raw materials, managing funds in the business, and determining the price of the commodity. A business organization can forecast demand for his product by making own estimations called guess or by taking the help of specialized consultants or market research agencies.
Significance of demand forecasting
Demand forecasting plays an important function in the management of various business decision. Forecasting help the business firm to know what is likely to happened in future and to reduce the degree of risk and uncertainty in business and to make various business policy decision and action of the future. Thus, a demand forecasting is meant to guide business policy decision.
The significance of demand forecasting are as follows:
1) Fulfils the objective: Demand forecasting implies that every business unit starts with certain pre-determined objectives. Demand forecasting helps in fulfilling these objectives. An organization estimates the current demand for its products and services in the market and move forward to achieve the set goals.
For example, an organization has set a target of selling 60, 000 units of its products. In such a case, the organization would make demand forecasting for its products. If the demand for the organization’s products is low, the organization would take remedial actions, so that the set objective can be achieved.
2) Production planning: Demand forecasting is important to forecast the future production plan of business firm. There is a gestation period between production of goods and services and demand for it. Demand forecasting help to eliminate those gaps between demand and supply of goods preventing shortages and surplus.
3) Distribution and avoidance of wastage of resources planning: The business firm has to take decision regarding the distribution of capital, machinery, raw material in the production process. So that if there is any shortage of those resources can be arranged prior through estimation. Making a right and correct estimation of using resources reduces the usage of it.
4) Sales distribution policy: Sales of goods and service gives revenue to the firm’s demand. Forecasting is nothing but estimating the sales of the product. To formulate realistic sales targets and to make arrangements for the movement of production for the movement of product region wise, demand forecasting is very essential. This can help to formulate an effective sales policy, and therefore, to increase sales revenue.
5) Price policy: The firm has to make decision regarding the price of goods and services which is a critical job. The firm has to make appropriate price policy so that there is no price fluctuation in the future.
6) Reduce business risk: Every business has certain risk. Demand forecasting help the business firm to make appropriate business decision to reduce such risk and uncertainty to a certain extent.
7) Inventory planning: Inventories are goods and raw materials held by the firm future sale. Demand forecasting helps in devising appropriate inventory management policies.
Q10) Discuss the steps to be taken to estimate demand forecasting. (5 marks)
A10)
Meaning
Demand forecasting means estimation of demand for the product for a future period. Demand forecasting enables an organization to take various decisions in business, such as planning about production process, purchasing of raw materials, managing funds in the business, and determining the price of the commodity. A business organization can forecast demand for his product by making own estimations called guess or by taking the help of specialized consultants or market research agencies.
Steps in demand forecasting
The demand forecasting finds its significance during largescale production of goods and services. During such period of time firms may often face difficulties in obtaining a fairly accurate estimation of future demand. Thus, it is essential for a firm to forecast demand systematically and scientifically to arrive at desired objective. Therefore, the following steps are to be taken to facilitate a systematic demand forecasting:
1. Determining the objective: The very first step in demand forecasting is to determine its objective of forecasting. The objective for which the demand forecasting is to be done must be clearly specified. The objective of forecasting may be defined in terms of; long-term or short-term demand, the whole or only the segment of a market for a firm’s product, overall demand for a product or only for a firm’s own product, firm’s overall market share in the industry, etc. The objective of the demand must be determined prior in the process of demand forecasting begins as it will give direction to the whole research.
2. Nature of forecast: After determining the objective of forecasting the second important step is to identified the nature of demand forecasting. Its based on the nature of forecasting.
3. Nature of commodity: While forecasting it is important to understand the nature of the product whether it is consumer goods or producer goods, perishable goods or durable goods. If the good is perishable the forecasting is to be done in a short period of time and for durable goods it may be done in long run.
4. Determinants of demand: Determinants of demand play an important role in determining the forecasting as different commodity have different factor determination of demand which depends upon the nature of commodity and nature of forecasting. The important determinants are price of the commodity, price of related goods, income of a consumer etc.
5. Identifying the relevant data: Necessary data for the forecasting are collected, then tabulated, analysed and crosschecked by the firm. The data are interpreted by applying various statistical or graphical techniques, and then to draw necessary deductions there from. The forecaster has to decide whether to choose primary or secondary data. The primary data are the first-hand data which has never been collected before. While the secondary data are the data already available. Often, data required is not available and hence the data are to be adjusted, even manipulated, if necessary, with a purpose to build a data consistent with the data required. Then after collecting the relevant data from different sources and proceed for the further step.
6. Selecting the method: After collecting the relevant data the firm choose the appropriate method of forecasting the demand. Appropriate method of sales forecasting is selected by the company considering the relevant information, purpose of forecasting and the degree of accuracy required. The choice of method has to be appropriate and logical. If the required data is not available toward the method, the forecaster may force to use less reliable method. The forecaster should use a method which should not be too time consuming and it should be reliable for long term.
7. Testing accuracy: After making a choice of method the forecaster needs to test the accuracy of it. There are various methods choose to test the accuracy. This testing helps to reduce the margin of error and thereby helps to improve its validity for the purpose of decision making
8. Evaluation and conclusion: the last and final step are to evaluate the forecasting and to draw a conclusion from it.
Q11) Explain the survey methods of demand forecasting? (8 marks)
A11)
Meaning
Demand forecasting means estimation of demand for the product for a future period. Demand forecasting enables an organization to take various decisions in business, such as planning about production process, purchasing of raw materials, managing funds in the business, and determining the price of the commodity. A business organization can forecast demand for his product by making own estimations called guess or by taking the help of specialized consultants or market research agencies.
Methods in demand forecasting
The main challenge to the forecaster while forecasting the demand is to select an effective technique or method. Broadly speaking methods of demand forecasting are classified into Qualitative methods and Quantitative methods. Which can also be classified as Survey method and Statistical method. The forecaster may choose any of the method depending upon the data which is available. Under these two broad categories, there are other specific methods which is been choose to analysis the data. These two methods will be discussed below:
- Survey method:
This method is also called as qualitative method of demand forecasting. This method is one of the most common and direct method of demand forecasting in the short run. In this method the future purchase plans of the consumers and their aims are included. An organization conducts these surveys with consumers to determine the demand of their existing products and services and forecast the future demand of their product accordingly.
The forecaster may undertake the following survey methods:
a) Expert’s opinion: This method is based on the opinion of expert who predict the demand for a product based on his experiences and his knowledge in the particular specialised field. The expert may be from the same organisation or may be hired from outside. They may be salesman, sales manager, marketing expert, market consultant etc they act as experts who can assess the demand for the product in different areas, regions, or cities. This method involves the opinion of three or four experts. Each expert will be asked about his opinion regarding the demand for the product and the expert through his personal experience give his opinion for the product and forecast the demand. This method is very simple to use and it requires less statistical work. Due to expert’s personal views the time for forecasting is short and the cost involve is also low. On the other side as its expert’s personal opinion or guess where its likely to be biased.
b) Delphi method: Delphi method is a group decision-making technique of forecasting demand. In Delphi method, a group of experts gives their opinion on the demand for the products of individual firm in future based on questions which have been asked by the firm. These questions are repeatedly asked until a result is obtained. In addition, each and every expert is provided information regarding the estimates made by other experts in the group, so that he/she can revise his/her estimations with respect to others’ estimates. In this way, the forecasters cross check among experts to reach more accurate decision making. The main advantage of this method is that it is time and cost effective as a number of experts are approached in a short time without spending much time on other resources. However, this method may lead to appropriate decision making. This method allows the forecaster to solve the problem to the experts at once and have instant response. But the success of this method depends upon the skills, experience, knowledge, and aptitude of the expert.
c) Consumer survey method: In this method, the consumers are directly approached to unveil their future purchase plans. This method is the most direct method because forecasting is done by interviewing all consumers or a selected group of consumers out of the relevant population through various other methods of survey. The firm may choose for complete enumeration method, sample survey method and end use method for sample surveys depending upon the nature of forecasting. The following methods are described in brief below:
- Complete enumeration method: Under the Complete Enumeration Survey, the forecaster undertakes the survey of the whole population who demand for the commodity. The firm may go for a door to door survey by making questionnaire to get the data requires. This method has an advantage of first hand data, unbiased information, yet it has its share of disadvantages also. The major limitation of this method is that it requires lot of resources, manpower and time period. There may be a chance where the consumer or the population may give false statement or may deliberately misguide the investigators due to which there may be chance of data error. In this method, consumers may be unwilling to reveal their purchase plans due to personal privacy or commercial secrecy.
- Sample survey method: This method is also known as test market. In this method the forecaster selects the samples of consumer from the relevant population instead of considering the whole population. If sample is the true representative of data, there is likely to be no significant difference in the results obtained by the survey. Apart from that, this method is less tedious and less costly then the complete enumeration method. A sample survey technique is a variant of test marketing. Product testing basically involves employing the product with a number of users for a set of periods of time. Their reactions to the product are noted after a period of time and an estimate of likely demand is made from the result. These are suitable for new products or for completely modified old products for which there is no prior data available. It is a more scientific method of estimating like demand because it stimulates the national launch in a very closely defined geographical area. Their can be a sampling error in this method as the size of sample is small i.e. smaller the size of sample larger the sampling error.
- End-use method: This method is quite useful for industries which are mainly producer’s goods and when a product is used for more than one use. In this method, the sale of the product is projected on the basis of demand survey of the industries which are using this product as an intermediate product, that is, the demand for the final product is the end user demand of the intermediate product which are used in the production of this final product is considered. The end use method of demand estimation of an intermediate product may involve many final good industries using this product at home and abroad. It helps us to understand inter-industry’ relations. The major efforts required by this type of method are not in its operation but in the collection and presentation of data. This will help the forecaster to manipulate the future demand. This policy helps the government to frame many of its policies. Its major limitations are that it requires every firm to have a plan of production correctly for the future period.
d) Market experiments: This method involves collecting necessary information regarding the current and future demand for a product in the market. This method carries out the studies and experiments on consumer behaviour under actual market conditions. In this method, some areas of markets are selected with similar features, such as income level , population, cultural and political background, and tastes of consumers. The market experiments are carried out with the help of changing prices and expenditure, so that the resultant changes in the demand are recorded. These results help in forecasting future demand.
- Actual market experiment: This method is conducted in the actual market place in several ways. One method is to select several market or stores with similar characteristics. This method is very useful in the process of introducing a product for which no other data exist.
- Simulated market experiment: This method is also called as consumer clinic or laboratory experiment. Under this method the firm make a set of consumers and give them a sum of money and asked them to shop in a stimulated store. While shopping the consumer reaction towards the change in price of a product, packaging, advertisement etc are taken into consideration.
Q12) Examine the statistical methods of demand forecasting? (5 marks)
A12)
This method is also called as quantitative method. Statistical method is most useful in demand forecasting. In order to key objectivity, that is, by consideration of all implications and viewing the problem from an external point of view, the statistical methods are used to forecast the demand of the product to get the accurate solution to the problems. The following are some statistical methods which are been used now a day:
- Trend method: A firm existing for a long time will have its own data regarding sales for past years. Such data when arranged in a chronologically manner will yield what is referred to as ‘time series. Time series method shows the past sales with effective demand for a particular product under normal conditions. Such data can be given in a tabular or graphic form for further analysis. This is the most popular method among business firms, partly because it is simple 50 and cheap and partly because time series data often show a persistent growth trend. Time series has got four types of components namely, Secular Trend (T), Secular Variation (S), Cyclical Element (C), and an Irregular or Random Variation (I). These time elements are expressed by the equation O = TSCI. Secular trend refers to the long run changes that occur as a result of general tendency. Seasonal variations refer to the changes in the short run weather pattern or the social habits. Cyclical variations refer to the changes that occur in industry during a depression and boom period. Random variation refers to the factors which are generally able such as wars, strikes, natural calamities such as flood, famine and so on. When a prediction is made the seasonal, cyclical and random variations are removed from the observed data. Thus, only the secular trend is left. This trend is then projected. Trend projection fits a trend line into a mathematical equation. The trend can be estimated by using any one of the following methods:
- The Graphical Method: Graphical method is the simplest technique to determine the trend analysis. All values of output or sale of product for different years are plotted on a graph and a smooth free hand curve is drawn passing through as many points as possible on the graph. The direction of this free hand curve is either upward or downward and shows the possible trend.
- The Least Square Method: Under the least square method of forecasting, a trend line can be fitted to the time series data with the help of statistical techniques such as least square method of regression. When the trend in sales over time is given by straight line, the equation of this line is in the form of: y = a + bx. Where ‘a’ is the intercept and ‘b’ shows the impact of the independent variable. We have taken two variables i.e. the independent variable x and the dependent variable y. The line of best fit establishes a kind of mathematical relationship between the two variables v and y. This is expressed by the regression у on x.
In order to solve the equation v = a + bx, we have to make use of the following normal equations:
Σ y = na + b ΣX
Σ xy =a Σ x+b Σ x2
2. Regression method: regression methods attempts to assess the relationship between at least two variables (one or more independent and one dependent), the purpose is to predict the value of the dependent variable from the specific value of the independent variable. The foundation of this prediction generally is historical data. This method starts from the assumption that a basic relationship exists between two variables. An interactive statistical analysis computer package is used to formulate this mathematical relationship.
Q13) Explain income elasticity of demand in details? (8 marks)
A13)
Income elasticity of demand
The income elasticity is measures the sensitivity of quantity demanded for a goods or services to a change in consumer’s income
 Formula - Percentage change in the quantity demanded
Percentage change in the consumer’s income
Types
- Positive income elasticity of demand -
When a proportionate change in the income of a consumer increases the demand for a product and vice versa, income elasticity of demand is said to be positive. In case of normal goods, the income elasticity of demand is generally found positive.
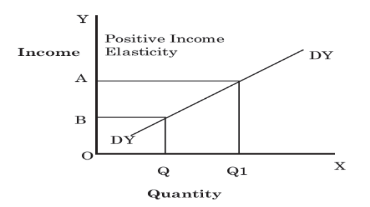
In Figure, DYDY is the curve representing positive income elasticity of demand. The curve is sloping upwards from left to the right, which shows an increase in demand (OQ to OQ1) as a result of rise in income (OB to OA).
2. Negative income elasticity of demand –
When a proportionate change in the income of a consumer results in a fall in the demand for a product and vice versa, income elasticity of demand is said to be negative. In case of inferior goods, the income elasticity of demand is generally found negative.
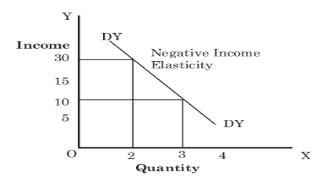
In Figure, DYDY is the curve representing negative income elasticity of demand. The curve is sloping downwards from left to the right, which shows a decrease in the demand as a result of a rise in income. As shown in Figure, with a rise in income from 10 to 30, the demand falls from 3 to 2.
3. Zero income elasticity of demand –
When a proportionate change in the income of a consumer does not bring any change in the demand for a product, income elasticity of demand is said to be zero. It generally occurs for utility goods such as salt, kerosene, electricity.
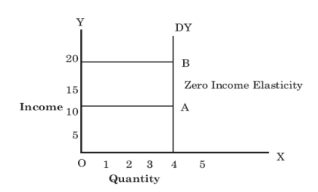
In Figure, DYDY is the curve representing zero income elasticity of demand. The curve is parallel to Y-axis that shows no change in the demand as a result of a rise in income. As shown in Figure, with a rise of income from 10 to 20, the demand remains the same i.e. 4.
Measurement of income elasticity of demand
The income elasticity of demand can be calculated by either point method or arc method.
Formula for point elasticity of demand is:
PED =
%ΔQ/Q
————-
% Δ P / P
To get more precision, you can use calculus and measure an infinitesimal change in Q and Price ( where ð = very small change) This is the slope of the demand curve at that particular point in time.

Arc Elasticity
Arc elasticity measures the midpoint between the two selected points:

Income elasticity of demand being zero may be a great significance. It implies that a given increase within the income of a consumer doesn't at all result in any increase in quantity demanded of a commodity or expenditure on that.
Classification of goods based on income elasticity of demand: we will broadly classify the varied goods on the idea of value of income elasticity of demand.
1. Normal Goods: Normal goods are those goods which are usually purchased by consumer as his income increases. In other words, normal good means a rise in income causes an increase within the demand for a commodity. It’s a positive income elasticity of demand. Normal goods are further classified as:
a. Necessity goods: a good with an income elasticity less than one and which claims declining proportion of consumers income as he becomes richer is named a necessity good. Necessity goods are those goods where an increase in income of a consumer results in but proportionate increases within the demand for a commodity. For example, daily used goods, basic goods etc. the income elasticity of demand for such goods positive and less then unity. i.e. Ey< 1.
b. Luxuries goods: a good having income elasticity over one and which therefore bulks larger in consumer’s budget as he becomes richer is named a luxury good. Luxuries goods are those goods where a change in income results in direct and over proportionate change in quantity demand for a commodity. For instance, diamonds, expensive cars, etc. Thus, income elasticity of demand for such goods is positive and greater than one i.e. Ey> 1.
c. Comfort goods: Comfort goods are those goods where change in income results in direct and proportionate change in quantity demanded. For instance, semi-luxury goods and comfort items. Income elasticity of such goods is positive and unity. Ie. Ey = 1.
2. Inferior goods: Inferior goods are those goods are where consumer buys less of products as his income increases. Goods having negative income elasticity are referred to as inferior goods. As income of a consumer increases his demand for goods shifts from inferior to superior The income elasticity for such goods are Ey = 0.
3. Neutral goods: when a change in income of a consumer brings no change within the quantity demanded of a commodity. For example, salt, rice, pulses etc. elasticity for such goods are Ey = 0.
Q14) explain significance of elasticity of demand? (5 marks)
A14)
Under law of demand, price falls and demand rises, vice versa. But how much the quantity rise or fall for a given change in price is not determined in law of demand. So the concept of elasticity of demand is derived to know how much quantity demanded changes for a change in the price of goods or services.
“The elasticity (or responsiveness) of demand in a market is great or small according as the amount demanded increases much or little for a given fall in price, and diminishes much or little for a given rise in price”. – Dr. Marshall.
Elasticity means sensitivity of demand to the change in price.
The formula for calculating elasticity of demand is:
EP = proportional changes in quantity demanded/proportional changes in price
Significance of elasticity of demand
- Monopoly and Elasticity of Demand: The objective of a seller in monopoly market is profit maximization. Since he is a single seller in monopoly, market having total control over supply and price, he can take decisions about price policy and get more profit. If demand is inelastic for the product sold by monopolist, he will raise the price of that commodity and earn more profit.
- Taxation Policy and Elasticity of Demand: The concept of Price Elasticity of Demand is useful to the government in the determination of taxation policy. The finance minister considers the Elasticity of Demand, while selecting goods and services for taxation. If government wants more revenue, those goods will be taxed more, for which demand is inelastic. Therefore, generally heavy taxes are imposed on goods like cigarettes, liquors and actual goods for which demand is inelastic.
- Fixation of Wages and Elasticity of Demand: The concept of Elasticity of Demand is useful to trade unions in collective bargaining, for wage determination. When trade union leaders know that demand for their product is inelastic, they will insist for more wages to workers.
- International Trade and Elasticity of Demand: The concept of Elasticity of Demand is useful to determine norms and conditions in international trade. The countries exporting commodities for which demand is inelastic can raise their prices. For instance, Organization of Petroleum Exporting Countries (OPEC) has increased the prices of oil several times. The concept is also useful in formulating export and import policy of a country.
- Public Utilities: In case of public utilities like railways which have an inelastic demand, to avoid consumer’s exploitation government can either subsidize or nationalize them. This shows need government monopoly.
Q15) Explain the relationship between elasticity of demand and revenue concept? (5 marks)
A15)
The term revenue refers to income obtained by the firm through sale of goods and services at different prices
Definition
In the words of Dooley, ‘the revenue of a firm is its sales, receipts or income’.
Revenue are of 3 types as given below

- Total Revenue
a) Income received by the seller after selling the output is called total revenue
b) “Total revenue is the sum of all sales, receipts or income of a firm.” Dooley
c) TR = Q x P
Where,
TR – Total Revenue
Q – Quantity of sale (units sold)
P – Price per unit of output
2. Average Revenue
a) Refers to revenue earned by the seller be selling the per unit of commodity
b) “The average revenue curve shows that the price of the firm’s product is the same at each level of output.” Stonier and Hague
c) AR=TR/Q
Where, AR – Average Revenue, TR – Total Revenue – Total units sold
3. Marginal revenue
a) Marginal revenue is the net revenue the firm receives by selling an additional unit of the commodity.
b) “Marginal revenue is the change in total revenue which results from the sale of one more or one less unit of output.” Ferguson.
c) MR=Change in TR/ change in unit sold
Relationship between price elasticity and total revenue:
Elasticities of demand can be divided into three broad categories: elastic, inelastic, and unitary. An elastic demand is one in which the elasticity is greater than one, indicating a high responsiveness to changes in price. Elasticities that are less than one indicates low responsiveness to price changes and correspond to inelastic demand. Unitary elasticities indicate proportional responsiveness of either demand or supply, as summarized in the following table:
Total revenue | Change in price | Elasticity | Reasons |
Increase Decrease | Fall Rise | Ep > 1 | Percentage change in quantity demanded is greater than the percentage change in price. |
Decrease Increase | Fall Rise | Ep < 1 | Percentage change in quantity demanded is smaller than percentage change in price |
Unchanged Unchanged | Fall Rise | Ep = 1 | Percentage change in quantity demanded is equal to percentage change in price. |
The relationship between the price elasticity and total revenue shows the following analysis from the above table.
A. When demand is elastic, price and total revenue move in opposite directions.
B. When demand is inelastic, price and total revenue moves in same direction.
C. When demand is unitary elastic, total revenue remains unchanged with the price changes.
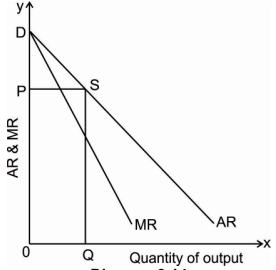
This relationship can be explained with the following diagram
Relationship between price elasticity and Average revenue and Marginal revenue: The relationship between AR, MR and elasticity of demand is very useful to understand at any level of output.
This relationship is also very useful to understand the price determination under different market conditions. It has been discussed that average revenue curve of a firm is the same thing as the demand curve of the consumer for the product of the firm under market.
Q16) Explain measurement of income elasticity? (5 marks)
A16)
The income elasticity is measures the sensitivity of quantity demanded for a goods or services to a change in consumer’s income
 Formula - Percentage change in the quantity demanded
Percentage change in the consumer’s income
Measurement of income elasticity of demand
The income elasticity of demand can be calculated by either point method or arc method.
Formula for point elasticity of demand is:
PED =
%ΔQ/Q
————-
% Δ P / P
To get more precision, you can use calculus and measure an infinitesimal change in Q and Price ( where ð = very small change) This is the slope of the demand curve at that particular point in time.

Arc Elasticity
Arc elasticity measures the midpoint between the two selected points:

Income elasticity of demand being zero may be a great significance. It implies that a given increase within the income of a consumer doesn't at all result in any increase in quantity demanded of a commodity or expenditure on that.
Classification of goods based on income elasticity of demand: we will broadly classify the varied goods on the idea of value of income elasticity of demand.
1. Normal Goods: Normal goods are those goods which are usually purchased by consumer as his income increases. In other words, normal good means a rise in income causes an increase within the demand for a commodity. It’s a positive income elasticity of demand. Normal goods are further classified as:
a. Necessity goods: a good with an income elasticity less than one and which claims declining proportion of consumers income as he becomes richer is named a necessity good. Necessity goods are those goods where an increase in income of a consumer results in but proportionate increases within the demand for a commodity. For example, daily used goods, basic goods etc. the income elasticity of demand for such goods positive and less then unity. i.e. Ey< 1.
b. Luxuries goods: a good having income elasticity over one and which therefore bulks larger in consumer’s budget as he becomes richer is named a luxury good. Luxuries goods are those goods where a change in income results in direct and over proportionate change in quantity demand for a commodity. For instance, diamonds, expensive cars, etc. Thus, income elasticity of demand for such goods is positive and greater than one i.e. Ey> 1.
c. Comfort goods: Comfort goods are those goods where change in income results in direct and proportionate change in quantity demanded. For instance, semi-luxury goods and comfort items. Income elasticity of such goods is positive and unity. Ie. Ey = 1.
2. Inferior goods: Inferior goods are those goods are where consumer buys less of products as his income increases. Goods having negative income elasticity are referred to as inferior goods. As income of a consumer increases his demand for goods shifts from inferior to superior The income elasticity for such goods are Ey = 0.
3. Neutral goods: when a change in income of a consumer brings no change within the quantity demanded of a commodity. For example, salt, rice, pulses etc. elasticity for such goods are Ey = 0.
Q17) Explain demand curve in perfect competition? (5 marks)
A17)
Demand Curve in Perfect Competition:
Perfect competition is said to prevail when there are large number of producers (firms) producing and selling homogenous product. The maximum output produce by the individual firm is very small relatively to the total demand to the industry product so that firm cannot affect the price by varying its supply of output. The seller is the price taker he accepts the price determined in the market by market demand and market supply. Thus, the individual price under perfect competition is determine by the market demand and market supply.
Market Demand Curve: The market demand curve under perfect competition is downward sloping. Because price and quantity demand are inversely related to each other as the price of a commodity increases the demand for that good decreases. The market price at which the firms will sell their commodity is determined by the interaction of market demand and market supply. Once the market determines the price for the commodity all firms will fix their price equals to market price as they are price taker under the perfect competition. Thus, the individual demand curve is equal to the equilibrium price of the market. The Diagram below shows the market demand curve which is downward sloping and P0 is the equilibrium market price which is followed by all the individual firm and the individual firm is facing the horizontal demand curve.
Individual Firm demand curve: Demand curve facing an individual firm working under prefect competition is perfectly elastic i.e. a horizontal straight line parallel to X axis at a given price which is determined by the market demand sand market supply. The Diagram below shows Qty demanded on X axis and Price of the commodity on Y axis. Where OP1 is the price determined by the interaction of market demand and market supply curve. It shows if firm tries to lower the price, he will get negative profit.
Q18) What is law of demand? (5 marks)
A18)
The law of demand states that all other factors remain constant or equal, an increase in the price causes a decrease in the quantity demanded and a decrease in goods or services price leads to increase in the quantity demanded. Thus it expresses an inverse relationship between price and demand.
For example, at Rs 70 per kg consumer may demand 2 kg of apple. On the other hand, the price rises to 100/- per kg then he may demand 1 kg of apple
Assumption of law of demand
- No change in the income.
- No change in size population.
- No change in price of related goods.
- No change in consumers taste, preferences, etc.
- No expectation of a price change in future.
- No change in climate conditions.
Given these assumption, the law of demand is explained in the below table –
Price(rs) | Quantity demanded |
10 | 10 |
8 | 20 |
6 | 30 |
4 | 40 |
2 | 50 |
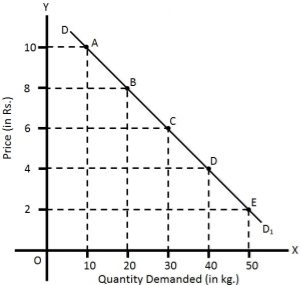
The above table shows that when the price of apple, is Rs. 10 per kg, 10 kg are demanded. If the price falls to Rs.8, the demand increases to 20 kg. Similarly, when the price declines to Rs 2, the demand increases to 50 kg. This indicates the inverse relation between price and demand.
Also, in the above figure the demand curve slopes downwards as the price decreases, the quantity demanded increases.
Exception of law of demand
Under the following circumstances, consumers buy more when the price of a commodity rises, and less when price falls which leads to upward sloping demand curve.
5. Giffen goods are those products where the demand increases with the increase in price. For example, necessities products like rice, wheat. Lower incomes group will spend less on superior foods (like meat) to buy more rice, wheat etc.
6. In anticipation of war, consumers start buying even when the prices are high due to the fear of shortage.
7. During a depression, the prices of products are low still the demand for those products is also less.
8. the law of demand is not applicable on necessities of life such as food, cloth etc
Q19) Explain the determinants of demand? (8 marks)
A19)
Meaning of demand
Ordinarily, DEMAND means a desire or want for something. In economics, however, demand means much more than that. Economics attach a special meaning to the concept of demand i.e. ‘Demand is the desire or want backed up by money.’ It means effective desire or want for a commodity, which is backed up the purchasing power and willingness to pay for it.
Demand, in economics, means effective demand for a commodity. It requires three conditions on the part of consumer.
- Desire for a commodity.
- Capacity to buy or purchased.
- Willingness to pay its price.
 In short,
Demand = Desire + Ability to pay + Willingness to spend
Demand is always related to Price & Time. Demand is not the absolute term. It is a relative concept. Demand for a commodity should always have a reference to Price & Time.
 For e.g. – Price Grapes for house hold at a price of Rs. 20/- per Kg., Rs. 10/- per Kg
 Time per day, per month, per year
Definition:
The Demand for a commodity refers to the quantity of a commodity that a person is willing to buy at different prices during period of time.
Determinants of demand
- Price of commodity (Px): The price of commodity is very important determinants of demand for any commodity. Other things remaining same, the rise in price of the commodity, the demand for the commodity contracts, and with the fall in price, its demand expands. So, the quantity demanded and price shows an inverse relationship in the case of normal goods. In other word changes in price brings changes in the consumer’s demand for that commodity.
2. Income (Y): Another important determinant of demand for a commodity is consumer’s income. Change in consumer’s income also influences the change in consumer’s demand for a commodities. The demand for normal goods increases with the increasing level of income and vice versa. It shows a direct relationship between income and quantity demanded.
3. Price of related commodities (Py): The demand for a commodity is also affected by the price of other commodities, especially of substitute or complementary goods. A good may have some related goods either substitute or complementary. The relation between two may be different.
- Substitute Goods: Substitute Goods are those goods which can be substituted from each other. For Instance Tea & Coffee. When the rise in the price of Tea causes rise in demand for Coffee because there is no change in price of coffee such goods are called as substitute goods. In other words the relation between two substitute goods are positive. An incase the price of one commodity increase the demand for other.
- Complementary Goods: Complementary goods are those goods which one purchased together. For Instance Car & Petrol. When their a rise in price of Petrol leads to fall in demand for Car such goods are called complementary good. In other words, the relation between two complementary goods are negative. An increase in price of one commodity leads to decrease in demand for other.
4. Taste and Preference (T): The demand for a commodity also depends on the consumer’s taste and preferences such as change in fashion, culture, tradition etc. As the consumers taste and preference for a particular commodity changes the demand for that particular commodity also changes. Therefore, Taste and Preference of a consumer plays an important role.
5. Advertising expenditure (A): Advertising expenditure by a firm influence the demand for a commodity. The advertisements by the manufacturer and sellers attract more customers towards the commodity. There exists positive relationship between advertising expenditure and demand for the commodity
6. Size and Composition of population: Demand for goods depends also on the size of population. Larger the number of people larger will be the demand for goods. Age composition also influences the demand for the goods. For e.g. – A larger number of children in the country will increase the demand for baby food and toys.
7. Future expectation: Demand for goods depends also on consumer’s expectation about the future changes. They may include expectations about changes in price, income, prices of related goods, availability of goods and so on. For e.g. – If consumers expect prices of essential goods to rise they will buy more of them now. On the other hand, expectation of decline in price will reduce the present demand.
8. Availability of credits: Demand for expensive and durable goods depends also an availability of credit. Greater the availability of credit, larger will be the demand. For e.g. – Availability of Loans for buying houses, cars, motorcycles etc. has influenced the demand for these goods.
9. Climatic condition: Demand for certain goods is also influenced by whether or climatic conditions. For e.g. Demand for umbrellas, woolen clothes etc. are seasonal in nature.
10. Social factors: Demand for goods is also influenced by social customs, traditions and practices. For e.g. – during Diwali there is greater demand for sweets and crackers.
Q20) Write short note on demand and demand function? (5 marks)
A20)
Demand function
Demand function is an arithmetic expression that shows the functional relationship between the demand for a commodity and therefore the various factors affecting it. This includes the income of a consumer and therefore the price of a commodity along side other various determining factors affecting demand. The demand for a commodity is that the dependent variable, while its determinants factors are the independent variables.
The demand for a commodity depends on various factors which determines the quantity of a commodity demanded by various individuals or a bunch of people . The subsequent equation shows the demand function which expresses the connection between the number demanded of a commodity X and its determinants.

Where,
Qdx = Quantity demanded of commodity X.
Px = Price of commodity X.
Y = income of a consumer.
Py = Price of related commodities.
T = Taste and Preference of a consumer.
A= Adverting expenditure made by producer.
Meaning of demand
Ordinarily, DEMAND means a desire or want for something. In economics, however, demand means much more than that. Economics attach a special meaning to the concept of demand i.e. ‘Demand is the desire or want backed up by money.’ It means effective desire or want for a commodity, which is backed up the purchasing power and willingness to pay for it.
Demand, in economics, means effective demand for a commodity. It requires three conditions on the part of consumer.
- Desire for a commodity.
- Capacity to buy or purchased.
- Willingness to pay its price.
 In short,
Demand = Desire + Ability to pay + Willingness to spend
Demand is always related to Price & Time. Demand is not the absolute term. It is a relative concept. Demand for a commodity should always have a reference to Price & Time.
 For e.g. – Price Grapes for house hold at a price of Rs. 20/- per Kg., Rs. 10/- per Kg
 Time per day, per month, per year
Definition:
The Demand for a commodity refers to the quantity of a commodity that a person is willing to buy at different prices during period of time.