Unit 2
Ratio Analysis and Interpretation
Q1) Write a note on different types of balance sheet ratio. 3x6
A1)
Balance Sheet Ratio
It deals with relationship between two items appearing in the balance sheet, e.g., current assets to current liability or current ratio. These ratios are also known as financial position ratios since they reflect the financial position of the business.
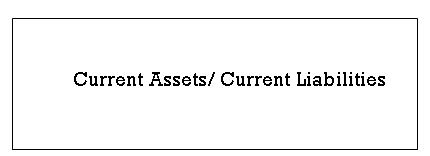
i) Current Ratio
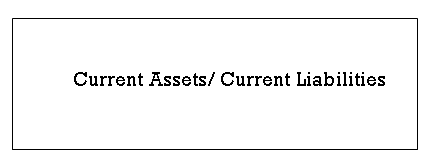
Current ratio also known as the working capital ratio, is the most widely used ratio. It is the ratio of total current assets to current liabilities and is calculated by dividing the current assets by current liabilities. Current assets are those assets which can be converted into cash in the short-run or within one year. Likewise, current liabilities are those which are to be paid off in the short run. Current assets normally include cash in hand or at bank, inventories, sundry debtors, loans and advances, marketable securities, pre-paid expenses, etc. while current liabilities consist of sundry creditors, bills payable, outstanding and accrued expenses, provisions for taxation, proposed and un-claimed dividend, bank overdraft etc. Current ratio indicates the firms’ commitment to meet its short-term obligations. It is a measure of testing short-term solvency or in other words, it is an index of the short-term financial stability of an enterprise because it shows the margin available after paying off current liabilities. It is calculated as-
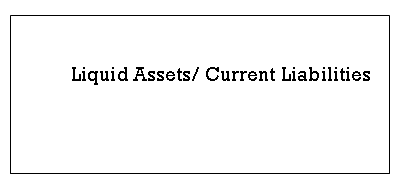
Ii) Liquid Ratio
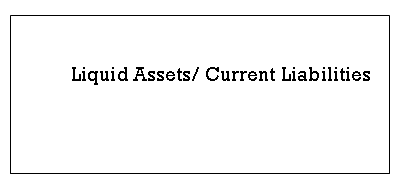
This ratio is also known as Quick Ratio or Acid Test Ratio. This ratio is calculated by relating liquid or quick assets to current liabilities. Liquid assets mean those assets which are immediately converted into cash without much loss. All current assets except inventories and prepaid expenses are categorised as liquid assets. This ratio is an indicator of the liquid position of an enterprise. Generally, a liquid ratio of 1:1 is considered as ideal as the firm can easily meet all current liabilities.
Iii) Stock Working Capital Ratio
This ratio shows the number of times working capital is turned-over in a stated period. It indicates to what extent the working capital funds have been employed in the business towards sales. This ratio is calculated as:

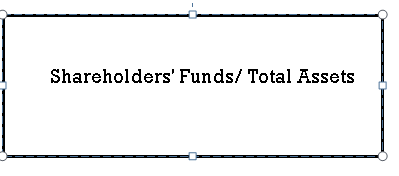
Iv) Proprietary Ratio
This ratio is a variant of debt-equity ratio which establishes the relationship between shareholders funds and total assets. Shareholders’ fund means, share capital both equity and preference and reserves and surplus less losses. This ratio indicates the extent to which shareholders’ funds have been invested in the assets. This ratio is worked out as follows:
v) Debt Equity Ratio
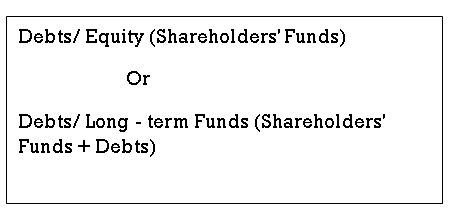
Debt-equity ratio is the relation between borrowed funds and owners’ capital in a firm, it is also known as external-internal equity ratio. The debt-equity ratio is used to ascertain the soundness of long-term financial policies of the business. Debt means long-term loans i.e. debentures or long-term loans from financial institutions. Equity means shareholders’ funds i.e., preference share capital, equity share capital, reserves less loss and fictitious assets like preliminary expenses. It is calculated in the following ways:
Vi) Capital Gearing Ratio
The proportion between fixed interest or dividend bearing funds and non-fixed interest or dividend bearing funds in the total capital employed in the business is termed as capital gearing ratio. Debentures, long-term loans and preference share capital belong to the category of fixed interest/dividend bearing funds. Equity share capital, reserves and surplus constitute non-fixed interest or dividend bearing funds. In case the fixed income bearing funds are more than the equity shareholders’ funds, the company is said to be highly geared. A low capital gearing implies that equity funds are more than the amount of fixed interest bearing securities. This ratio indicates the extra residual benefits accruing to equity shareholders. This ratio is calculated as follows:

Q2) What is revenue statement ratio. Write a note on different types of revenue statement ratio. 12
A2) These ratios express the relationship between two individual or group of items appearing in the income or profit and loss statement. Since they reflect the operating conditions of a business, they are also known as operating ratios, e.g., gross profit to sales, cost of goods sold to sales, etc.
i) Gross Profit Ratio
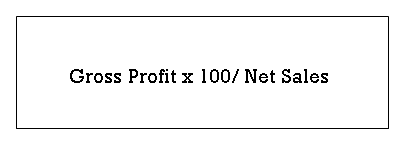
Gross profit ratio expresses the relationship of gross profit to net sales or turnover. Gross profit is the excess of the proceeds of goods sold and services rendered during a period over their cost, before taking into account administration, selling and distribution and financing charges. This ratio is important to determine general profitability since it is expected that the ratio would be quite high
So as to cover not only the remaining costs but also to allow proper returns to owners. It is calculated as-

Ii) Expenses Ratio
It measures how much of a fund’s assets are used for administrative and other operating expenses. It is determined by dividing a fund’s operating expenses by average value of its assets. It is calculated as-

Iii) Operating Ratio
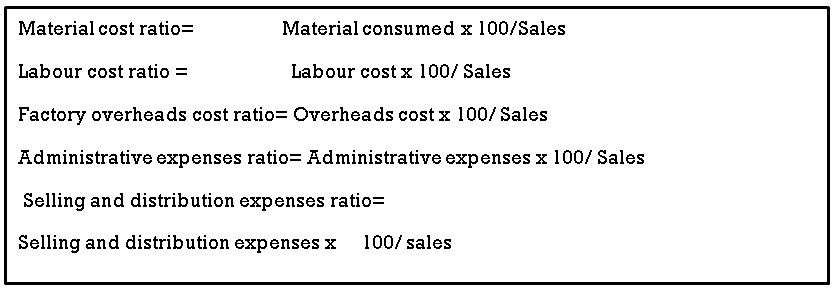
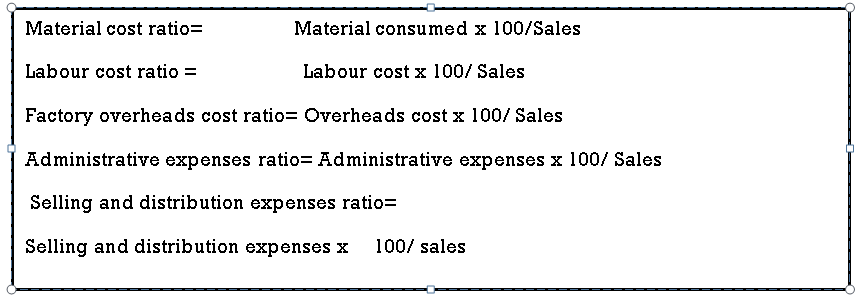
The ratio of all operating expenses (i.e., materials used, labour, factory overheads, office and selling expenses) to sales is the operating ratio. A comparison of the operating ratio would indicate whether the cost content is high or low in the figure of sales. If the annual comparison shows that the sales has increased, the management would be naturally interested and concerned to know as to which element of the cost has gone up. The major components of cost are: material, labour and overheads. Therefore, it is worthwhile to classify the cost ratio as:
Iv) Net Profit Ratio
One of the components of return on capital employed is the net profit ratio (or the margin on sales). It indicates the net margin earned in a sale of 100. Net profit is arrived at from gross profit after deducting administration, selling and distribution expenses; non-operating incomes, such as dividends received and non-operating expenses are ignored, since they do not affect efficiency of operations. It is calculated as-

v) Net Operating Profit Ratio
A measure of ‘profitability’ is the overall measure of efficiency. In general terms efficiency of business is measured by the input-output analysis. By measuring the output as a proportion of the input, and comparing result of similar other firms or periods the relative change in its profitability can be established. Profitability ratio can be determined on the basis of either investments or sales. Profitability in relation to investments is measured by return on capital employed, return on shareholders’ funds and return on assets. The profitability in relation to sales are profit margin (gross and net) and expenses ratio or operating ratio. It is calculated as-

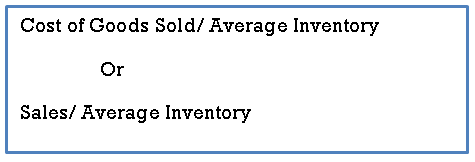
Vi) Stock Turnover Ratio
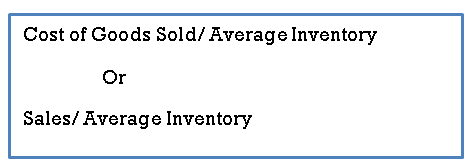
This ratio is an indicator of the efficiency of the use of investment in stock. It is calculated as
Q3) Write a note on combined ratio. 5
A3) These ratios express the relationship between two items, each appearing in different statements, i.e., one appearing in balance sheet while the other in income statement, e.g., return on investment (net profit to capital employed); Assets turnover (sales) ratio, etc. Since both the statements are involved in the calculation of each of these ratios, they are also known as inter statement ratios. It consist of –
i) Return on capital employed (Including Long Term Borrowings)
Ii) Return on proprietor's Fund (Shareholders Fund and Preference Capital)
Iii) Return on Equity Capital,
Iv) Debtors Turnover,
v) Creditors Turnover,
Vi) Debt Service Ratio,
Vii) Dividend Payout Ratio.
Q4) Write a small note on Return on capital employed.
A4) This ratio is also known as overall profitability ratio or return on capital employed. The income (output) as compared to the capital employed (input) indicates the return on investment. It shows how much the company is earning on its investment. This ratio is calculated as follows:

Where, Operating profit= Profit before interest and tax
Capital employed= Share Capital + Reserve and Surplus + Long term
Loans − Non-Operating Assets − Fictitious Assets
Q5) What is Return on proprietor's Fund and return on equity capital. 5
A5) Return on proprietor's Fund-
It is also referred to as return on net worth. In this case it is desired to work out the profitability of the company from the shareholders’ point of view. This ratio would reflect the profitability for the shareholders. To extend the idea further, the profitability from equity shareholders’ point of view can also be worked out by taking the profits after preference dividend and comparing against capital employed after deducting both long-term loans and preference capital.

Return on Equity Capital
This ratio shows the efficiency of capital employed in the business. The higher the ratio the greater are the profits. It is calculated as

Q6) What is debtor’s turnover ratio and creditor’s turnover ratios. 5
A6)
Debtors Turnover
This ratio measures the net credit sales of a firm to the recorded trade debtors thereby indicating the rate at which cash is generated by turnover of receivable or debtors. This ratio is calculated as:

Average debtors= opening debtors + closing debtors/2
While calculating debtors turnover, it is important to note that provision for bad and doubtful debts are not deducted from total debtors in order to avoid the impression that a larger amount of receivables have been collected.
Creditors Turnover
Like debtors’ turnover ratio, this ratio indicates the speed at which the payments for credit purchases are made to creditors. The term ‘creditors’ include, trade creditors and bills payable. In case the details regarding credit purchases, opening and closing balances of creditors are not available, then instead of credit purchases, total purchases may be taken and in place of average creditors, the balance available may be substituted. This ratio is computed as follows:

Q7) Define debt service ratio and dividend pay-out ratio. 5
A7)
Debt Service Ratio
This ratio is also known as Fixed Charges Cover or Interest Cover. This ratio measures the debt servicing capacity of a firm in so far as fixed interest on long-term loan is concerned. It is determined by dividing the net profit before interest and taxes by the fixed charges on loans. This ratio is expressed as ‘number of times’ to indicate that profit is number of times the interest charges. It is also a measure of profitability. Since higher the ratio, higher the profitability. The ideal ratio should be 6 to 7 times. It is calculated as-

Dividend Payout Ratio
This ratio establishes the relationship between the market price and the dividend paid per share. It is expressed as a percentage and gives the rate of return on the market value of the shares and helps in the decision of investors who are more concerned about returns on their investment rather than its capital appreciation. Since dividends are declared on paid-up value of shares, they do not reflect the actual rate of earning if the shares are purchased at market price, which is generally different from paid-up value. This ratio removes this ambiguity by relating the dividends to the market value of shares. This ratio is calculated as under-

Q8) What are different operating ratios? 5
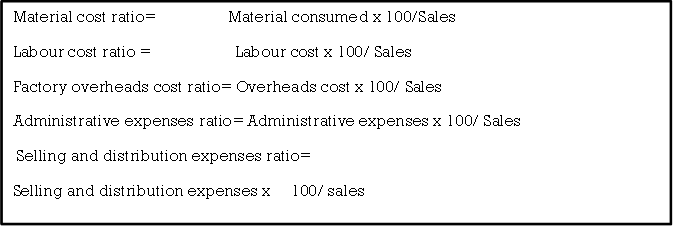
A8) The ratio of all operating expenses (i.e., materials used, labour, factory overheads, office and selling expenses) to sales is the operating ratio. A comparison of the operating ratio would indicate whether the cost content is high or low in the figure of sales. If the annual comparison shows that the sales has increased, the management would be naturally interested and concerned to know as to which element of the cost has gone up. The major components of cost are: material, labour and overheads. Therefore, it is worthwhile to classify the cost ratio as:
Q9) What is ratio analysis? How ratio analysis facilitates analysis of liquidity position of a company. 2+6
A9) Ratio analysis is used to evaluate relationships among financial statement items. The ratios are used to identify trends over time for one organisation or to compare two or more organisations at one point in time. Ratio analysis focuses on three key aspects of a business: liquidity, profitability, and solvency. Ratio Analysis is an important tool for any business organisation. The computation of ratios facilitates the comparison of firms which differ in size. Ratios can be used to compare a firm's financial performance with industry averages. In addition, ratios can be used in a form of trend analysis to identify areas where performance has improved or deteriorated over time.
Different ratios that facilitates analysis of liquidity position of a company are discussed below-
i) Current Ratio
Current ratio also known as the working capital ratio, is the most widely used ratio. It is the ratio of total current assets to current liabilities and is calculated by dividing the current assets by current liabilities. Current assets are those assets which can be converted into cash in the short-run or within one year. Likewise, current liabilities are those which are to be paid off in the short run. Current assets normally include cash in hand or at bank, inventories, sundry debtors, loans and advances, marketable securities, pre-paid expenses, etc. while current liabilities consist of sundry creditors, bills payable, outstanding and accrued expenses, provisions for taxation, proposed and un-claimed dividend, bank overdraft etc. Current ratio indicates the firms’ commitment to meet its short-term obligations. It is a measure of testing short-term solvency or in other words, it is an index of the short-term financial stability of an enterprise because it shows the margin available after paying off current liabilities. It is calculated as-
Ii) Liquid Ratio
This ratio is also known as Quick Ratio or Acid Test Ratio. This ratio is calculated by relating liquid or quick assets to current liabilities. Liquid assets mean those assets which are immediately converted into cash without much loss. All current assets except inventories and prepaid expenses are categorised as liquid assets. This ratio is an indicator of the liquid position of an enterprise. Generally, a liquid ratio of 1:1 is considered as ideal as the firm can easily meet all current liabilities.
Iii) Stock Working Capital Ratio
This ratio shows the number of times working capital is turned-over in a stated period. It indicates to what extent the working capital funds have been employed in the business towards sales. This ratio is calculated as:

Q10) How does revenue statement analysed with the help of ratio analysis? 12
A10) Revenue statement is analysed with the help of following ratios-
i) Gross Profit Ratio
Gross profit ratio expresses the relationship of gross profit to net sales or turnover. Gross profit is the excess of the proceeds of goods sold and services rendered during a period over their cost, before taking into account administration, selling and distribution and financing charges. This ratio is important to determine general profitability since it is expected that the ratio would be quite high so as to cover not only the remaining costs but also to allow proper returns to owners. It is calculated as-
Ii) Expenses Ratio
It measures how much of a fund’s assets are used for administrative and other operating expenses. It is determined by dividing a fund’s operating expenses by average value of its assets. It is calculated as-

Iii) Operating Ratio
The ratio of all operating expenses (i.e., materials used, labour, factory overheads, office and selling expenses) to sales is the operating ratio. A comparison of the operating ratio would indicate whether the cost content is high or low in the figure of sales. If the annual comparison shows that the sales has increased, the management would be naturally interested and concerned to know as to which element of the cost has gone up. The major components of cost are: material, labour and overheads. Therefore, it is worthwhile to classify the cost ratio as:
Iv) Net Profit Ratio
One of the components of return on capital employed is the net profit ratio (or the margin on sales). It indicates the net margin earned in a sale of 100. Net profit is arrived at from gross profit after deducting administration, selling and distribution expenses; non-operating incomes, such as dividends received and non-operating expenses are ignored, since they do not affect efficiency of operations. It is calculated as-
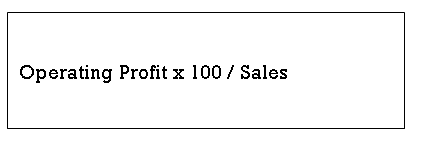
v) Net Operating Profit Ratio
A measure of ‘profitability’ is the overall measure of efficiency. In general terms efficiency of business is measured by the input-output analysis. By measuring the output as a proportion of the input, and comparing result of similar other firms or periods the relative change in its profitability can be established. Profitability ratio can be determined on the basis of either investments or sales. Profitability in relation to investments is measured by return on capital employed, return on shareholders’ funds and return on assets. The profitability in relation to sales are profit margin (gross and net) and expenses ratio or operating ratio. It is calculated as-

Vi) Stock Turnover Ratio
This ratio is an indicator of the efficiency of the use of investment in stock. It is calculated as-
