Unit - 3
Morera’s theorem
Q1) State and prove Morera’s theorem.
A1)
We use standard texts like Spiegel (1964) or Levinson and Redheffer in this case (1970).
If for each closed contour C within a complicated area R and

Then f(z) is analytic everywhere in 𝑅.
Proof:
Assume that the hypothesis is false, and that there is a contour in some part of R such that

Where 𝐴 is nonzero.
We assume that the real and imaginary parts of f(z) are continuously differentiable in 𝑅, (otherwise  would not exist at some points in 𝑅 and f(z) would not be analytic by the definition of analyticity.)
Rewriting the integral by substituting real and imaginary parts  and
and  we obtain

Because the partial derivatives of u(x,y) and v(x,y) exist, we may invoke the 2D version of Green's theorem for the real and imaginary parts

Because  at least one of the Cauchy-Riemann equations is not satisfied, and the theorem is proven. However, this proof is less satisfactory, because we had to assume that the real and imaginary parts of f(z) were differentiable.
Q2) What are Sequences of holomorphic functions, Holomorphic functions defined in terms of integrals.
A2)
The fact that if fj is a sequence of holomorphic functions on a planar domain and the sequence converges uniformly on compact subsets of is a standard and well-known fact from complex function theory (which appears to be due to Weierstrass (see [WEI]; closely related results appear in [STE] and [VIT]). Certainly, this conclusion is one of the explanations for the compact-open topology being applied to the space of holomorphic functions on (see also [LUR], where this point of view is developed in detail from the perspective of functional analysis).
The following result of William Fogg Osgood [ OSG ] is even less widely known:
1st Theorem Let fj be a holomorphic function sequence on a planar domain. Assume that the fj pointwise converge to the limit function f on. Then on a dense, open subset of, f is holomorphic. On compact subsets of the dense, open set, convergence is uniform.
This finding isn't immediately apparent; yet, it is undoubtedly surprising and intriguing. For the sake of completeness, here is a proof of the theorem:
Proof of the Theorem: Let U be a nonempty open subset of Ω with compact closure in Ω. Define, for k = 1,2,...,

Since the fj converge at each z ∈ U, certainly the set {fj(z) : j ∈ N} is bounded for each fixed z. So each  lies in some Sk. In other words,

Because U is a full metric space (in the Euclidean sense), the Baire category theorem states that some Sk must be “somewhere dense” in U. Sk will therefore have a nontrivial Euclidean metric ball (or disc) in U. B is the name of the ball. It's now just a matter of using Montel's theorem to B to discover a subsequence fjk that converges uniformly to a limit function g on compact sets. But, of course, g and f must be the same, and g (and so f) must be holomorphic on B.
Because the choice of U in the preceding arguments was arbitrary, the theorem's conclusion follows.
Remark: An alternative approach, which avoids the explicit use of Montel’s theorem, is as follows. Once one has identified an Sk whose closure contains a ball or disc D(P,r), let γ be a simple closed curve in D(P,r). Then of course the image γ of γ is a compact set. Let > 0. By Lusin’s theorem, the sequence fj convergese uniformlye on some subset E ⊆ γe with the property that the linear measure of γ \ E is less than . Let K be a compact subset of the open region surrounded by γ, and let δ > 0 be the Euclidean distance of K to γ. Let ∗ > 0 and choose J > 0 so large that when j,k > J then

For all z ∈ E. Then, for w ∈ K,


Thus we see that we have uniform convergence on K. And the holomorphicity follows as usual.
Q3) Explain about Results on Planar Domains.
A3)
Harmonic functions are the subject of our first new result for planar domains:
Theorem number two Let fj denote a succession of harmonic functions on a plane. Assume that the fj pointwise converge to the limit function f on.
Then on a dense open subset of, f is harmonic.
A sketch of the theorem's proof is as follows: Proceed as in the holomorphic functions verification of the result. It is unmistakably true that a subsequence of harmonic functions on a planar domain that is uniformly bounded on compact sets will converge uniformly on compact sets. This is based on simple Poisson kernel estimates. The rest of the argument is identical to the previous one.
3rd Theorem On a planar domain, let L be a uniformly elliptic operator of order 2. Let fj represent a set of functions that L on annihilates. Assume that the fj pointwise converge to the limit function f on. Then, on a dense open subset of, L annihilates f.
The proof is identical to the previous finding. The only thing to look for is a subsequence that converges uniformly on compact sets given a collection of functions annihilated by L that is bounded on compact sets. This follows from the Poisson formula for L, just as it did in the harmonic case. The remainder of the argument is identical.
4th Theorem Let fj be a holomorphic function sequence on a planar domain. Assume that for all j and all z, there is a constant M > 0 such that |fj(z)| M. Assume that the fj pointwise converge to the limit function f on. Then all of is holomorphic to f.
Remark: Of course, the new feature of Stieltjes [STElast ]'s theorem is that we assume the family fj is uniformly limited. This Tauberian hypothesis leads to a more conclusive result. This time, the proof will be a little different.
Assume that U is an open subset of. Then the argument from Theorem 1's proof applies to U right away. As a result, the limit function on U is holomorphic. We're done because the choice of U was arbitrary.
In reality, a much weaker condition (than in the previous theorem) yields the same result:
Theorem No. 5 Let fj be a holomorphic function sequence on a planar domain. Assume that for all j and all z, there is a nonnegative, integrable function g on such that |fj(z)| g(z). Assume that the fj pointwise converge to the limit function f on. Then, on a set of measure zero, f can be rectified so that it is holomorphic on all of itself. Let ϕ be a Cc∞ function on Ω. Then
Proof: The proof is simplicity

For each j. Here dA is Lebesgue area measure on C. Now the Lebesgue dominated convergence theorem allows us to let j → ∞ and infer that

As a result, f is a holomorphic function with a weak holomorphic property. But, according to Weyl's lemma, f can be corrected on a set of measure zero, making it holomorphic in the classical sense.
The 6th Theorem Let fj be a pointwise convergent sequence of univalent holomorphic functions on a domain. The limit function is therefore holomorphic over all.
To prove that, one must first notice that each fj's picture is missing an arc (this is a standard fact about univalent functions that follows simply from the topology of the Riemann sphere and the open mapping principle). Then each fj is postcomposed with an automorphism j of the Riemann sphere, resulting in two complex values p and q being ignored by all the fj. [These automorphisms will, by necessity, converge to the identity.] The family j fj is then normal, according to Montel's classic theorem (see [MON]). We can observe that the original family fj is normal after unravelling the rationale.
The outcome is obvious right away.
Q4) Explain Results in Several Complex Variables.
A4)
In Cn, the first result is as follows.
Theorem No. 7 Let fj denote a set of holomorphic functions on the domain Cn. Assume that the fj pointwise converge to the limit function f on. Then on a dense open subset of, f is holomorphic. On compact subsets of the dense open set, the convergence is also uniform.
The reasoning for Theorem 2 is the same as for Theorem 1. We merely need to remember that Montel's theorem still holds true. The remainder of the argument is identical.
Remark: We might use the Henkin-Ramirez integral formula on small balls to give an alternate proof of this result, much as we did in the Remark following the demonstration of Theorem 1.
Theorem no. 8 Let fj denote a set of holomorphic functions on the domain Cn. Assume that the fj pointwise converge to the limit function f on. In Cn, let be any complex line. Then on a dense open subset of, the limit function f is holomorphic.
Proof: Of course, we just use the logic from Theorem 1's proof to.
Note that this is a more powerful result than Theorem 6. Something similar may be demonstrated if "complex line" was replaced by "complex analytic variety." It's unclear what the best outcome would be.
Q5) Explain Integration of holomorphic functions.
A5)
We can try to integrate holomorphic functions because they are continuous functions. The complex plane provides us more flexibility in defining such integrals than the real line: integrating g: RR from a real number a to a larger real number b is clear, but integrating g: RR from a holomorphic function to a bigger real number b is not. f: C→C To understand the integral, we must provide a path from a complex number a C to a complex number b C. In other words, we can write Z b.
 but should write
Then one can inquire as to how this is affected by the path taken from point a to point b. The most essential property of holomorphic functions for physics and engineering is revealed here:
(3) If 0 can be deformed into 1 using a set of t pathways with the same endpoints and constant dependence on t, then

This results in a highly powerful way for computing integrals, because you can choose to make your life as simple as possible.

Example (Contour integration). If γ(0) = γ(1) and γ can be deformed in Ω to a constant map while keeping its endpoints fixed, then

Surprising, as γ could be some large circle.
Q6) Define Schwarz’s reflection principle.
A6)
As an application of Schwarz's reflection principle, we show that a holomorphic map between two domains can expand into a holomorphic map between neighbourhoods of both domains if the domain boundaries are analytic curves.
A curve φ : [T0,T1] →C is called an analytic curve if φ is analytic function (i.e., it has power series expansion at each point). φ is called non-singular if φ′(t) =6 0, ∀t ∈ [T0,T1].
We could write φ(t) = φ1(t) + iφ2(t) where φ1 and φ2 are real-valued functions. Then
φ is analytic ⇐⇒ φ1 and φ2 are analytic
And φ is non-singular ⇔
Theorem 24.2 Let D1,D2 ⊂C be domains and z1 ∈ ∂ D1 and z2 ∈ ∂D2. Let f : D1 → D2 be a holomorphic map such that f is continuous up to ∂D1∩Uz1 where Uz1 is a neighborhood of z1 in C, that f(z1) = z2, and that f(∂D1 ∩Uz1) ⊂ ∂D2 ∩Uz2. Suppose that ∂D1 ∩Uz1 and
∂D2 ∩ Uz2 are non-singular analytic curves. Then there exist neighborhoods
 and
and  in
in  such that f : D1 → D2 extends to a holomorphic map .

Proof: By the definition of real analytic curves, we consider the following commutative diagram


Where φ1(0) = z1,φ2(0) = z2, C+ = {z ∈ C | Im(z) > 0}. Here we may shrink Uz1 and Uz2 if necessary. By Schwarz reflection principle, f2 can extend holomorphically to  . Therefore we have proved the desired holomorphic extension.
Q7) Explain about Zeros and poles with example.
A7)
Without solving the whole differential equation, the transfer function can be used to determine crucial system response properties. The transfer function is a rational function in the complex variable, as specified. s = σ + jω, that is
 (1)
(1)
It's common practise to factor the numerator and denominator polynomials and write the transfer function in terms of those factors:
 (2)
(2)
Where the real coefficients of the numerator and denominator polynomials, N(s) and D(s), are specified by the system's differential equation, and K = bm/an The zi's are the equation's roots, as given in Eq. (2).
N(s) = 0, (3)
And are defined to be the system zeros, and the pi’s are the roots of the equation
D(s) = 0, (4)
The system poles are specified as and. The factors in the numerator and denominator are expressed in Eq. (2) so that when s = zi, the numerator N(s) = 0 and the transfer function disappears, that is, when s = zi, the numerator N(s) = 0 and the transfer function vanishes.

Likewise, when s = pi, the denominator polynomial D(s) = 0 and the transfer function's value becomes unbounded.

Because all of the coefficients of polynomials N(s) and D(s) are real, the poles and zeros must be solely real or appear in complex conjugate pairs. For the poles in general, either pi = σi, or else pi,pi+1 = σi±jωi. In the polynomial D, the occurrence of a single complex pole without a corresponding conjugate pole would result in complex coefficients (s). The system zeros, likewise, are either real or appear in pairs of complex conjugate pairs.
Q8) A linear system is described by the differential equation

Find the system poles and zeros.
A8)
From the differential equation the transfer function is
 (5)
(5)
Which may be written in factored form
 (6)
(6)
At s = 1/2, the system has a single real zero, and at s = 3 and s = 2, it contains a pair of real poles.
The poles and zeros of the transfer function, and hence of the differential equation representing the input-output system dynamics, are properties of the transfer function. They characterise the differential equation and provide a complete description of the system when combined with the gain constant K.
Q9) A system has a pair of complex conjugate poles p1,p2 = −1 ± j2, a single real zero z1 = −4, and a gain factor K = 3. Find the differential equation representing the system.
A9)
The transfer function is
 (7)
(7)
And the differential equation is
 (8)
(8)
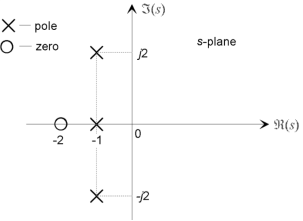
Figure: The pole-zero plot for a typical third-order system with a single real zero and one real pole and a complex conjugate pole pair.
Q10) What are System Poles and the Homogeneous Response ? explain The Pole-Zero Plot.
A10)
The poles and zeros of a system are important because they allow the input/output differential equation to be reconstructed. A transfer function's poles and zeros can be complex in general, and the system dynamics can be graphically depicted by charting their locations on the complex s-plane, whose axes represent the real and imaginary components of the complex variable s. Pole-zero plots are what they're called. A circle () is used to indicate a zero location, and a cross () is used to indicate a pole location. The positions of the poles and zeros provide qualitative information about a system's response characteristics. The poles and zeros of a system can be determined using a variety of computer programmes based on the transfer function or system state equations [8]. Figure 1 shows a pole-zero plot for a third-order system with a single real zero, a real pole, and a pair of complex conjugate poles, that is;

The poles and zeros of the transfer function effectively characterise the system response since it entirely reflects a system differential equation. The system poles, in particular, directly define the components of the homogeneous response. A linear SISO system's unforced reaction to a set of beginning conditions is called
 (9)
(9)
The exponents I are the roots of the characteristic equation or the system eigenvalues, and the constants Ci are found from the provided set of beginning circumstances. The distinguishing equation is
D(s) = sn + an−1sn−1 + ... + a0 = 0, (10)
And its roots are the system poles, that is λi = pi, leading to the following important relationship:
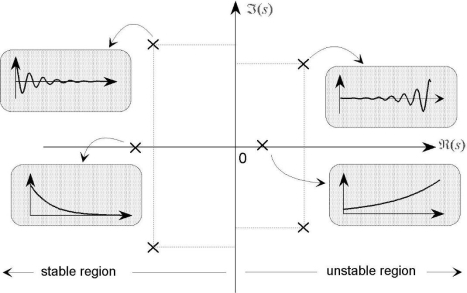
Figure: The specification of the form of components of the homogeneous response from the system pole locations on the pole-zero plot.
The transfer function poles are the roots of the characteristic equation, and also the eigenvalues of the system A matrix.
The homogeneous response may therefore be written
 . (11)
As a result, the n components in the homogeneous response are defined by the placement of the poles in the s-plane, as shown below:
- A real pole pi = −σ in the left-half of the s-plane defines an exponentially decaying component, Ce−σt, in the homogeneous response. The pole placement in the left-half plane determines the rate of decay; poles far from the origin correspond to rapidly decaying components, whereas poles near the origin relate to slowly decaying components. A pole at the origin pi = 0 defines a component that is constant in amplitude and defined by the initial conditions.
- A real pole in the right-half plane corresponds to an exponentially increasing component Ceσt in the homogeneous response; thus defining the system to be unstable.
- A complex conjugate pole pair σ ± jω in the left-half of the s-plane combine to generate a response component that is a decaying sinusoid of the form Ae−σt sin(ωt + φ) where A and φ are determined by the initial conditions. The rate of decay is specified by σ; the frequency of oscillation is determined by ω.
- An imaginary pole pair, that is a pole pair lying on the imaginary axis, ±jω generates an oscillatory component with a constant amplitude determined by the initial conditions.
- The rate of decay is determined by the pole placement in the left-half plane; poles far from the origin correspond to rapidly decaying components, whereas poles close to the origin correspond to slowly decaying components.
These results are summarized in Fig
Q11) Comment on the expected form of a system's reaction to an arbitrary set of beginning conditions using the pole-zero plot depicted in Fig.
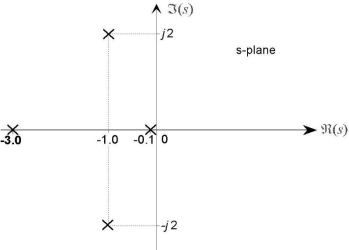
Figure: A fourth-order system with two real and two complex conjugate poles has a pole-zero plot.
A11)
The system has four poles and no zeros. The two real poles correspond to decaying exponential terms C1e−3t and C2e−0.1t, and the complex conjugate pole pair introduce an oscillatory component Ae−t sin(2t + φ), so that the total homogeneous response is
yh(t) = C1e−3t + C2e−0.1t + Ae−t sin(2t + φ) (12)
Despite the fact that the relative intensities of these components in each given circumstance are influenced by the initial conditions, the following basic conclusions can be made:
- The term e−3t, with a time-constant τ of 0.33 seconds, decays rapidly and is significant only for approximately 4τ or 1.33 seconds.
- The response has an oscillatory component Ae−t sin(2t + φ) defined by the complex conjugate pair, and exhibits some overshoot. The oscillation will decay in approximately four seconds because of the e−t damping term.
- The term e−0.1t, with a time-constant τ = 10 seconds, persists for approximately 40 seconds. It is therefore the dominant long term response component in the overall homogeneous response.
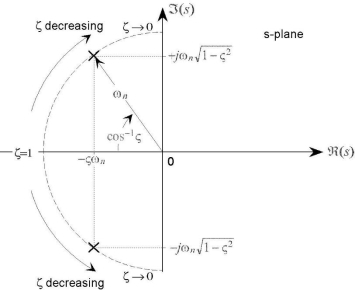
Figure: Definition of the parameters ωn and ζ for an underdamped, second-order system from the complex conjugate pole locations.
The pole locations of the classical second-order homogeneous system
 (13)
(13)
Described in Section 9.3 are given by
 (14)
(14)
If ζ ≥ 1, The two poles are real and lie in the left-half plane, corresponding to an overdamped system. For a system that is underdamped, 0 ≤ ζ < 1, the poles form a complex conjugate pair,
 (15)
(15)
As seen in Fig, they are in the left-half plane. The poles are at a distance n from the origin and at an angle cos1() from the negative real axis, as shown in this diagram. An underdamped second-order system's poles are thus located on a semi-circle with a radius specified by n and an angle given by the damping ratio's value.
Q12) What is system stability?
A12)
The transfer function of a linear system can be used to determine its stability. Only if all of the components in the homogeneous response from a finite set of beginning conditions decay to zero as time passes is an nth order linear system asymptotically stable.
 (16)
(16)
The system poles are represented by the pi. As time passes in a stable system, all components of the homogeneous response must decay to zero. There is a component in the output that increases without bounds if any pole has a positive real part, causing the system to be unstable.
All of the poles of a linear system must have negative real parts in order for it to be stable, which means they must all lie within the left-half of the s-plane. In the system homogenous response, a "unstable" pole in the right half of the s-plane generates a component that increases without bound from any finite initial circumstances. The homogeneous response of a system with one or more poles on the imaginary axis of the s-plane has non-decaying oscillatory components, and it is described as marginally stable.
Q13) Explain Geometric Evaluation of the Transfer Function.
A13)
The transfer function can be evaluated for any s = + j value, and when s is complex, the function H(s) is complex as well. The complex value of the transfer function is commonly expressed in polar form as a magnitude and an angle:
 (17)
(17)
With a magnitude |H(s)| and an angle φ(s) given by

 (19)
(19)
Where {} is the real operator, and {} is the imaginary operator. If the numerator and denominator polynomials are factored into terms (s − pi) and (s − zi) as in Eq. (2) ,
 (20)
(20)
Each of the numerator and denominator factors is a complex quantity that can be understood as a vector in the s-plane, commencing at the point zi or pi and pointing to the point s at which the function is to be evaluated. For a pole pi = I I the magnitude and angle of the vector to the point s = + are
 (21)
(21)
 (22)
(22)
As depicted in Fig. 5a The magnitude and angle of the whole transfer function can therefore be represented as the product of the individual magnitudes and the sum of the component angles.
 (33)
(33)

The distance of the points from the pole or zero on the s-plane is the magnitude of each of the component vectors in the numerator and denominator. As a result, if the vector from the pole pi to the point s on a pole-zero plot has a length qi and an angle I from the horizontal, and the vector from the pole pi to the point s on a pole-zero plot has a length qi and an angle I from the horizontal, and the vector from the pole pi to the point s on a
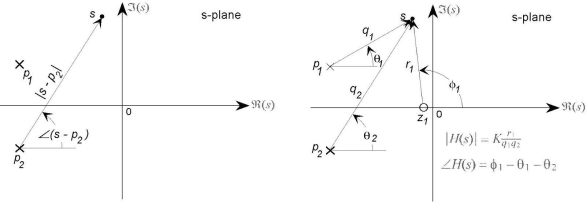
Figure: (a) In polar form, define s-plane geometric relationships. (b) From the pole-zero plot, a geometric assessment of the transfer function is performed.
As illustrated in Fig. b, the zero zi to the point s has a length ri and an angle i. The value of the transfer function at the point s is


Except for the overall "gain" component K, the transfer function for any value of s may be derived geometrically from the pole-zero plot. The product of the geometric distances on the s-plane from each zero to the point s divided by the product of the distances from each pole to the point determines the magnitude of the transfer function. The sum of the angles of the vectors associated with the zeros minus the sum of the angles of the vectors associated with the poles is the angle of the transfer function.
Q14) A second-order system has a s = 2j3 pair of complex conjugate poles and a single zero at the s-origin. Plane's To assess the transfer function at s = 0 + j5, find the transfer function and utilise the pole-zero plot.
A14)
From the problem description
 (27)
(27)
The pole-zero plot is shown in Fig. From the figure the transfer function is
 (28)
(28)
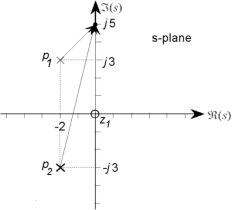
Figure: The pole-zero plot for a second order system with a zero at the origin. And  (29)
(29)
Q15) What are Frequency Response and the Pole-Zero Plot?
A15)
By directly replacing j for s in the factored form of the transfer function, the frequency response can be stated in terms of the system poles and zeros:
 (30)
(30)
Because the frequency response is the transfer function evaluated on the imaginary axis of the s-plane, when s = j, the graphical approach for assessing the transfer function described above may be easily applied to it. There is a magnitude and an angle for each of the vectors from the n system poles to the test point s = j


Analogous formulations for the vectors from the m zeros, as shown in Fig. a. The total frequency response's magnitude and phase angle can therefore be represented in terms of the magnitudes and angles of these component vectors.
 (33)
(33)
 (34)
(34)
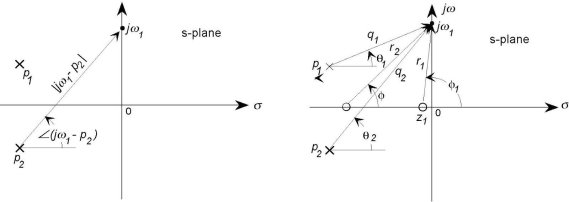
Figure: The vector quantities used to define the frequency response function from the pole-zero plot are defined here. The vector from a pole (or zero) is defined in (a), and the vectors from all poles and zeros in a typical system are displayed in
As indicated above, the value of the frequency response at the point j is if the vector from the pole pi to the point s = j has length qi and an angle I from the horizontal, and the vector from the zero zi to the point j has length ri and an angle I as illustrated in Fig. b.
 (35)
(35)
 (36)
(36)
The graphical method can be very useful for deriving a qualitative picture of a system frequency response. For example, consider the sinusoidal response of a first-order system with a pole on the real axis at s = −1/τ as shown in Fig. 8a, and its Bode plots in Fig. 8b. Despite the fact that the gain constant K cannot be derived from the pole-zero plot, the following observations can be made directly by observing the magnitude and angle of the vector from the pole to the imaginary axis when the input frequency is varied:
1. The gain approaches a finite value at low frequencies, and the phase angle has a small but finite lag.
2. As the input frequency rises, the gain reduces (because to the lengthening of the vector), and the phase lag rises with it (the angle of the vector becomes larger).
3. The gain approaches 0 at very high input frequencies, and the phase angle approaches /2.
Consider a second-order system where the damping ratio is selected so that the pair of complex conjugate poles is close to the imaginary axis, as shown in Fig. 9a. There are two vectors connecting the two poles to the imaginary axis in this situation, and by noticing how the lengths and angles of the vectors change as the test frequency advances up the imaginary axis, the following conclusions can be drawn:
1. The system has a finite (but indeterminate) gain at low frequencies, as well as a small but finite phase lag.
2. One of the vectors (associated with the pole in the second quadrant) reduces in length when the input frequency is raised and the test point on the imaginary axis approaches the pole.
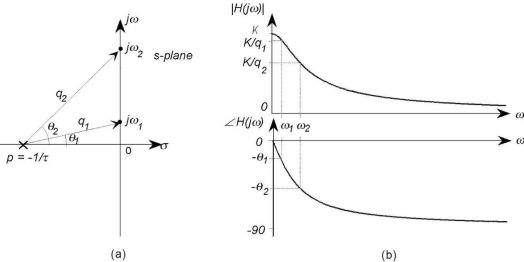
Figure: A first-order system's pole-zero plot and frequency response functions. And eventually reaches a minimal The magnitude function has an increase in value throughout a range of frequencies close to the pole.
The lengths of both vectors approach infinity at very high frequencies, and the magnitude of the frequency response approaches 0, while the phase approaches an angle of radians since the angle of each vector approaches
Based on the geometric interpretation of the pole-zero plot, the following generalisations regarding the sinusoidal frequency response of a linear system can be made.
1. When the number of poles in a system exceeds the number of zeros, the magnitude of the frequency response tends to zero as the frequency increases. Similarly, as the frequency of the input increases, the gain of a system with an excess of zeros increases without bound. In physical energetic systems, this is impossible because it implies an unlimited power gain via the system.
2. When a system has a pair of complex conjugate poles near the imaginary axis, the magnitude of the frequency response exhibits a "peak," or resonance, at frequencies near the pole. The system has an infinite gain at that frequency if the pole pair is directly on the imaginary axis.
3. If a system has a pair of complex conjugate zeros close to the imaginary axis, the magnitude function of the frequency response exhibits a “dip” or “notch” at frequencies near the zero. The response is exactly zero at the frequency of the zero if the pair of zeros is directly on the imaginary axis, and the system does not respond to sinusoidal excitation at that frequency.
4. An infinite gain at zero frequency is implied by a pole at the origin of the s-plane (equivalent to a pure integration term in the transfer function).
5. Similarly, a zero at the s-origin plane's (corresponding to a pure differentiation) means that the system has zero gain at zero frequency.
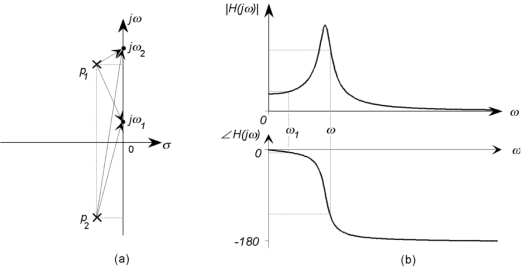
Figure: The frequency response functions and the pole-zero plot for a second-order system.
Q16) What are A Simple Method for constructing the Magnitude Bode Plot directly from the Pole-Zero Plot?
A16)
Except for an arbitrary gain constant, the pole-zero plot of a system has enough information to define the frequency response. Knowing the form of the magnitude Bode plot without knowing the absolute gain is frequently sufficient. Without drawing the individual component curves, the magnitude plot can be sketched using the method outlined here. The approach is based on the fact that at each break frequency, the entire magnitude curve changes slope.
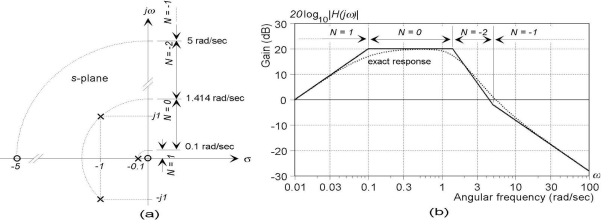
The first step is to find the break frequencies, which can be done either by calculating the transfer function or by looking at the pole-zero plot directly. Take a look at Figure 10a, which shows a typical pole-zero plot of a linear system. The break frequencies for the four first and second-order blocks are all equal to the radial distance between the poles or zeros and the s-origin. Plane's that is . As a result, all break frequencies can be discovered by tracing an arc from each pole or zero to the positive imaginary axis with a compass. These break frequencies can be simply transferred to the Bode plot's logarithmic frequency axis.
A pole or zero does not contribute to the magnitude Bode plot below its break frequency since all low frequency asymptotes are horizontal lines with a gain of 0dB. Each pole or zero provides a 20 dB/decade change in the asymptotic plot above its break frequency. A complex conjugate pole or zero pair defines two 20 dB/decade coincident breaks (one from each pair member), resulting in a total change in slope of 40 dB/decade. As a result, the slope of the asymptotic magnitude function at any frequency is solely determined by the number of break points at frequencies less than or to the left on the Bode plot. The slope of the curve at that frequency is 20 (Z P) dB/decade if there are Z breakpoints due to zeros to the left and P breakpoints due to poles.
Because they are effectively to the left of all finite break frequencies, any poles or zeros at the origin cannot be displayed on the Bode plot. They do, however, chara
Describe the starting incline. Figure 10: Construction of the magnitude Bode plot from the pole-zero diagram: If an arbitrary starting frequency and an assumed gain (for example, 0dB) at that frequency are chosen, the shape of the magnitude plot can be simply generated by noting the initial slope and building the The Bode plot is based on changes in slope at the break frequencies curve from straight line segments that change in slope by units of 20 dB/decade at the breakpoints. (a) shows a typical third-order system and the definition of the break frequencies. (b) shows the Bode plot based on changes in slope at the break frequencies curve from straight line segments that change in slope by units of 20 dB/decade at the breakpoints. The curve is vertically displaced when the reference gain is arbitrarily chosen.
The straight line magnitude plot for the system described in Fig. 10a created using this method is displayed in Figure 10b. A frequency range of 0.01 to 100 radians/sec was arbitrarily chosen, with a reference level gain of 0dB at 0.01 radians/sec. From the pole-zero plot, the break frequencies at 0, 0.1, 1.414, and 5 radians/sec were transferred to the frequency axis. At every frequency, N equals Z P, where Z represents the number of zeros to the left and P represents the number of poles to the left. The curve was created by simply assigning the slope value to each of the frequency intervals and connecting the lines.
Q17) How Transfer Function ↔ Pole Zero related?
A17)
A system's pole-zero and transfer function representations are inextricably intertwined. Consider the following transfer function:

If we put this in a standard form, the numerator and denominator's highest order terms will be unity (the reason for this is explained below).

This is simply a constant term (b0/a0) multiplied by a factorable polynomial ratio.

The constant k=b0/a0 is used in this equation. The zi terms represent the transfer function's zeros; when szi decreases, the numerator polynomial decreases, and the transfer function decreases as well. The poles of the transfer function are the pi terms; because the denominator polynomial of spi is zero, the transfer function travels to infinity.
A transfer function with an mth order numerator and an nth order denominator can be expressed as follows:

The poles (pi), zeros (zi), and gain term make up the pole-zero representation (k).
Q18) Evaluate the following integrals, justifying your procedures. For c) and d) you should also state why the integral is well defined (i.e., independent of the path taken).
(a)  , where C is the circle with radius 1/2 , centre 1, positively oriented;
(b)  where C is the lower half of the circle with radius 1, centre 0, negatively oriented
(c)
A18)
We have

Thus,

On the one hand,

By Cauchy integral formula, 
On the other hand, since  is analytic on and inside C, then

By Cauchy’s Theorem. Therefore,

(b) Notice that the integrated  ia analytic on C. The function
Serves as an antiderivative of f(z). Here log z is a branch of the logarithm chosen with the branch cut on the positive imaginary axis. That is,

Thus 
(c) Since the integrand  is analytic, the integral is path independent. An antiderivative of f(z) is
Thus

(d) Since the integrand  is analytic, the integral is path independent. An antiderivative of f(z) is

Thus 
Q19) Let CR be the circle with radius R, centre 0, positively oriented.
Show that

Use this fact to prove that, 
Where C is the circle with radius 5, centre 2, positively oriented.
A19)
Recall that for a contour C of length L and a piecewise continuous f(z) on C, if M is a nonnegative constant
Such that
| f(z)| < M for all points z on C at which f(z) is defined,
Then