Unit - 4
Real Gases
Q1) For the following equation of state

Show that


(c) Boyle temperature 
A1)


The last three terms of the equation are very small, except at very high pressures and small volume. Hence substituting v = RT/p.


At p=0, T=TB Boyle temperature


Q2) Write a note on the deviations from the ideal gas equation?
A2)
By the term Equation of State is meant the mathematical formula which expresses the relation between pressure, volume and temperature of a substance in any state- of aggregation.
If any two of these quantities be known, the third has a fixed value depending uniquely upon them, and can be determined if the equation of state is known, but this is seldom possible.
According to the laws of Boyle and Charles, we have for a perfect gas,
PV=RT. …………. (1)
This is the equation for a perfect gas.
But even Boyle himself found that the law held only under ideal conditions, Tilt, high temperatures and low pressure, while under ordinary conditions it did not correctly represent the true state of affairs for any actual gas.
For every temperature a curve can be drawn which has for its abscissa the volume and for its ordinate the corresponding pressure of the enclosed substance. These curves are called isothermals.
If equation (1) were true the isothermals ought to be rectangular hyperbolas parallel to each other, but experiments show that this is very seldom the case. The most extended earlier investigations are due to Regnault. He applied pressures up to 30 atmospheres while the temperature was varied from 0° to 100°C.
He plotted the product of as ordinate against p as abscissa. The curves ought to be straight lines parallel to the x axis; actually, however, they were inclined to it. He found that fur air, nitrogen and carbon dioxide the product pV decreases with incensing pressure, while for hydrogen it increases.
He also found that hydrogen shows an abnormal Joule-Thomson effect. These facts led him to describe hydrogen as "more than perfect'. If equation (1) were true the product pV ought to remain constant; thus these permanent gases were shown to be imperfect.
Later work by Natterer, Andrews and Cailletet using higher pressures confirmed the idea that the actual gases showed consider able deviations from equation (1).
Andrews' experiments are of fundamental importance as they throw much light no the actual behaviour of gases and form the basis of an important equation of state first proposed by van der Walls.
The most thoroughgoing and exact experiments arc due to Amagat Who investigated the behaviour of various gases up to a pressure of 3.000 atmospheres. His results particularly with CO, and ethylene showed that their behaviour is very complicated.
A different method has been utility by K. Onnes who, investigated the behaviour of several gases at very low temperatures and found that none of the numerous equations of state proposed correctly represents the results of experiments finds that at any temperature the results are best represented by an empirical equation of the type
PV = A + Bp + cp2+ Dp4 +………….. (2)
Where A, B, C..., are constants for a fixed temperature, but vary with temperature in a complicated manner. As many as twenty-five constants are used; they are called virial coefficients.
A is simply equal to RT while the values of the coefficients of higher terms diminish rapidly. Holborn and Otto, following Onne’s method, studied several gases up to 100 atmospheres and between the temperatures of — 183°C and ± 400°C, and found that they need take only four constants.
They give the values of these constants for various gases at different temperatures. The coefficient B is of particular importance. For all gases it varies in a similar way: at low temperatures it has a negative value, then it gradually increases to zero and becomes positive.
Now if at any temperature B = 0, and C, D are negligible as usual, then d(pV)/dp = p. Hence, at this temperature' Boyle's law will be obeyed up to fairly high pressures. This temperature is called the Boyle Point.
Q3) Discuss Virial equation?
A3)
A method of modelling real gases is to take the ideal gas equation and modify it using a power series in 1/Vm. Such that Vm is the molar volume. This results in virial expansion:

Where B, C are called virial coefficients and can be made to be temperature dependent. It will denote by B(T) and C(T)). The temperature at which the virial coefficient B(T) goes to zero is called the Boyle temperature TB since it is the temperature at which Boyle’s law is approximately obeyed (neglecting the higher-order virial coefficients), as shown in Figure.
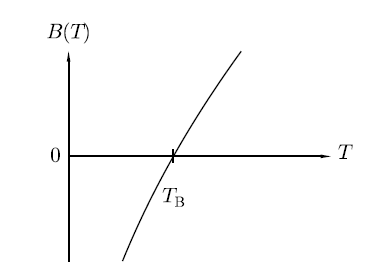
Figure 1: The temperature dependence of the virial coefficient B.
The additional terms in the virial expansion give knowledge about the nature of the intermolecular interactions. The total internal energy U of the molecules is
U = UK.E. + UP.E. …………… (1)
Where UK.E. Is the kinetic energy given by a sum over all N molecules

Where pi is the momentum of the ith molecule.
Internal potential energy UP.E. is

Where V(|ri − rj|) is the potential energy between the ith and jth molecules and the factor 1/2 is to avoid double counting of pairs of molecules in the sum. The partition function Z is then


As the integrals in momentum and in position variables are separable. Now ZK.E. Is the partition function for the ideal gas leads to the ideal gas equation pV = RT.
So, we will focus entirely on ZP.E. which is

Here we have included the factor 1/VN so that when UP.E. = 0 then ZP.E. = 1. Hence

And adding one and subtracting one from this equation, we have

We know intermolecular interactions are only significant for molecules that are virtually touching, so the integrand is appreciably different from zero only when two molecules are very close together.
If the gas is dilute this condition of two molecules being close will only happen relatively rarely, and so we will assume that this condition occurs only for one pair of molecules at any one time.
There are N ways of picking the first molecule for a collision, and N−1 ways of picking the second molecule for a collision. However, we don’t care about order of picking. The number of ways to select a pair of molecules from N molecules is

For large N, it is approximately written as N2/2. Writing r for the coordinate separating these two molecules, we then have

Since the integral depends only on the separation r, we can integrate out the other N − 1 volume coordinates and obtain

The virial coefficient B(T) is written as

We have

Hence


Where F0 is the Helmholtz function. The last equality is accomplished using ln (1 + x) ≈ x for x<<1. Hence, we can evaluate the pressure p as follows:

For one mole of ideal gas

Which is of the form of the virial expansion but with only a single non-ideal term.
Q4) Write the van der Waals equation of state in terms of a virial expansion and also give relation of Boyle temperature in terms of the critical temperature?
A4)
The van der Waals equation of state can be rewritten as
 ………….. (1)
Using the binomial expansion, the term in brackets can be expanded into a series and can be written as
 ………….. (2)
This is of similar form as the virial expansion
 ………….. (3)
The Boyle temperature TB is defined by B(TB) = 0 and hence
 ………….. (4)
Also, Boyle temperature in terms of the critical temperature is given as
 ………….. (5)
Q5) Discuss Andrews experiments on CO2 gas?
A5)
Andrews started his experiment in 1861 and completed in 1870. This is very known experiment. This gave the information about the effect of temperature and pressure on the volume of carbon dioxide.
Andrews studied the effect of pressure on the volume of gases at different temperatures. A simple apparatus is used for this purpose.
Construction
The apparatus consists of a thick-walled glass capillary tube T. Gas is enclosed in the tube with a drop of mercury. The capillary tube T is sealed into the metal compression chamber M. The chamber is filled with water and is connected through C to an exactly similar chamber with a glass tube of the type T but containing air. This latter tube served as a manometer. Gas used for experiment is contained in the capillary tube T. The pressure applied on the water by screwing up the screw, S, is hydraulically shifted from water to the volume of the air. To vary the temperature upper part of the carbon dioxide tube was surrounded by a heating bath.
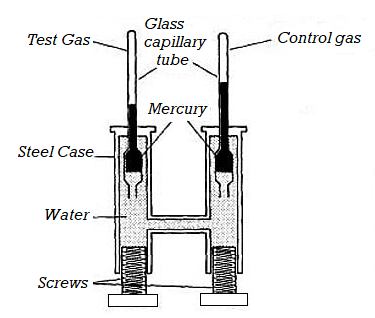
Figure 2: Andrews Experiments
Taking the same mass of carbon dioxide at different pressures and at different constant temperatures and Volume is taken into account. Curves were plotted by Andrews. These curves are named as Isothermals as each curve represents P-V data at a given temperature.
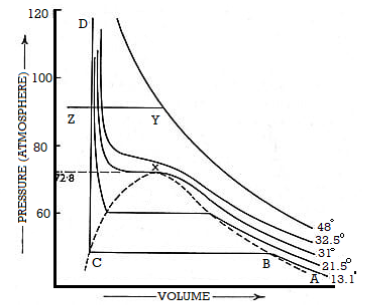
Figure 3: Curves were plotted by Andrews
Suppose the isothermal corresponding to the temperature T10C. At A, the pressure is low the volume is large
According to Boyle’s taw, when pressure is increased the volume decreases. At a particular volume B, liquefaction starts. However, there is rapid decrease in Volume but the pressure remains constant.
The isothermal is horizontal until all of the gas is liquefied and the point C is reached. The portion CD of the isothermal represents the effect of pressure on the volume of liquid carbon dioxide. This part is steep, almost vertical, indicating that the liquid is much less compressible than the gas.
The behaviour of carbon dioxide gas is represented by AB.
Along with BC both liquid and gas coexist. And also, are in equilibrium whereas the pressure remaining the same.
The pressure is independent of the relative quantities of liquid and gas.
It has been observed that the pressure at which a liquid and its vapour are in equilibrium at a given temperature and known as the vapour pressure of the liquid. It is an important quantity.
The isothermal at T20 C shows the same characteristic as that for T10C except that the horizontal portion showing the range of co-existence of liquid and gas is shorter than that for T10C.
At 31.1°C exceptional behaviour is observed. The horizontal portion gets rapidly shorter at higher temperature. However, at 31.1°C and above there is no horizontal portion at all.
At 31.1°C, there is a slight hump showing a very short range of co-existence of liquid and gas.
Andrews observed that in the liquefaction of carbon dioxide the temperature 31.1°C was critical. At any temperature above this value carbon dioxide gas could not he Liquefied even at a pressure of 300 to 400 atmospheres.
Whereas below this temperature, a much lower pressure would be enough to liquefy the gas. This is a common phenomenon for all gases, the temperature depending on nature.
Q6) Write note on Critical Constants?
A6)
Critical Constants
Critical Temperature: The temperature above which a gas cannot be liquefied, however high the pressure may be, called the critical temperature of the gas.
Critical Pressure: The pressure that is enough to bring about the liquefaction of the gas at the critical temperature is known as the critical pressure.
Critical Volume: The volume occupied by 1 mole of the substance at the critical pressure and temperature is called the critical volume.
Critical Isotherm: The pressure-volume curve at the critical temperature is known as the critical isotherm.
There is no crucial need of difference between easily liquefiable and permanent gases. All gases can be liquefied below their critical temperatures by the simple application of pressure.
Q7) Discuss Joule- Thomson cooling?
A7)
The Joule–Kelvin process is extremely useful for achieving the liquefaction of gases. The process must be carried out below the maximum inversion temperature of the particular gas.
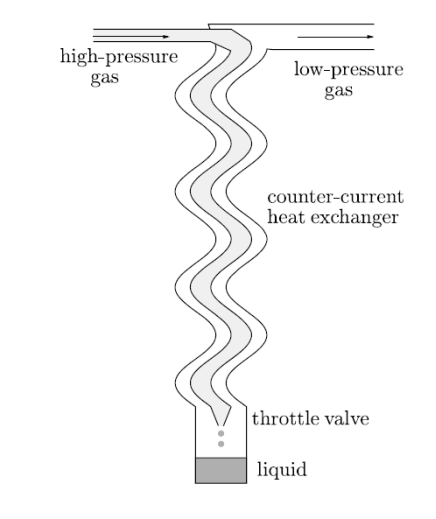
Figure 4: A schematic diagram of a gas liquefier.
A schematic diagram is shown in Figure. When high–pressure gas is passed through a throttle valve it gets cool by the Joule–Kelvin process.
Low– pressure gas plus liquid gives results. By use of a counter-current heat exchanger, the process can be made more effective. With the help of Counter-current heat exchanger the outgoing cold low–pressure gas is used to precool the incoming warm high-pressure gas. This help to confirm that by the time it reaches the throttle valve the incoming high–pressure gas is already as cool as it can be. This also help to confirm that it occurs at a temperature such that the Joule–Kelvin effect will result in cooling.
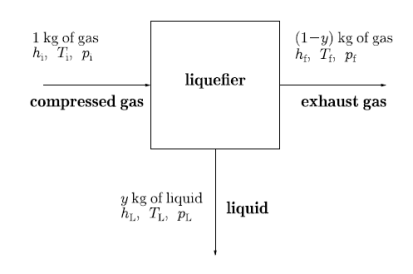
Figure 5: A block diagram showing the liquefaction process.
Let us look at its block diagram. Consider the black box as liquefier. In which 1 kg of warm gas is filled and get out y kg of liquid, as well as (1 − y) kg of exhaust gas.
The variable y is the efficiency y of a liquefier. That is the mass fraction of incoming gas which is liquefied. Since enthalpy is conserved in a Joule–Kelvin process, we have that

Where hi = Specific enthalpy of the incoming gas,
hL = specific enthalpy of the liquid,
hf = specific enthalpy of the outgoing gas.
Hence the efficiency y is given by

The temperature of the compressed gas Ti and the exhaust gas Tf will be the same for an efficient heat exchanger. We also have that pf = 1atm, and TL is fixed.
As the liquid will be in equilibrium with its vapour. Therefore, hf and hL are fixed. Only parameter which can vary is hi and to maximize y we must minimize hi

And since (∂h/∂p)T = −CpμJK, we therefore require that
μJK = 0
This means that it is best to work the liquefier right on the inversion curve (μJK = 0) for maximum efficiency.
Q8) What do you mean by Continuity of State?
A8)
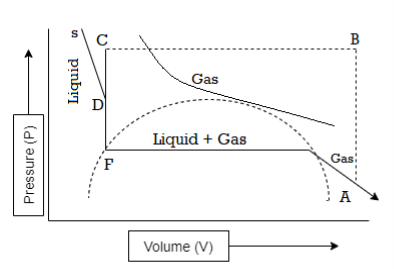
Figure 6: Continuity of State
As we have seen that at critical temperature, the densities of the substance in the two phases are the same and the boundary between the liquid phase and gas phase fades.
Both these states are the liquid and the gas at the critical temperature.
Continuity of State defines the property of a transition between two states of matter, during which physical properties do not show any abrupt change.
It was concluded that the state of matter like ordinary gaseous and liquid states are only widely separated states of matter. Such that one state may be made to pass to the other by a course of continuous physical changes without representing any discontinuity.
In simple words, the transformation from the gaseous state to the liquid state or vice versa may be made gradually through the phenomenon of condensation. During the transformation no two phases will co-exist.
This is known as Andrew’s theory of the “Continuity of State”.
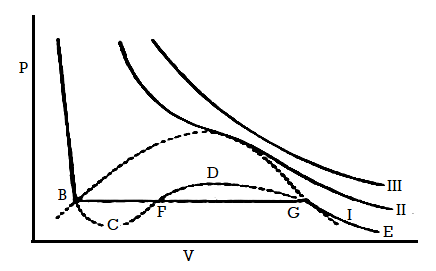
Figure 7: Continuity of State
The idea of the continuity of state can be explained with the help of above curve. The parts BC and GD of curve I can be understood experimentally.
Suppose gas in a perfectly clean and smooth vessel is compressed isothermally the volume decreases along the isothermal EG until the point G is reached and liquefaction start. However, if liquid does not form and the further increase in pressure produces a decrease in volume along the line GD. Along GD the gas may be termed as supersaturated or supercooled vapour. Further if there is increase in pressure beyond D, it results in quick liquefaction.
BC part of curve of the isotherm shows with the decrease of pressure the volume of the liquid increases along BC without vaporization starting at B.
The system is unstable along BC in the sense that a slight disturbance would be enough to cause the system to revert spontaneously to the stable state. That is equilibrium between the liquid and vapour states.
The part CFD represents the impossible situation that the volume increases when the pressure is increased.
The continuous curve ABCFDGE represents the P-V relation of the substance in both the states.
We know that the van der Waals equation mathematically represents curve I, whereas it is impossible to get an analytical expression which will correspond to the isothermals below the critical temperature as obtained by Andrews.
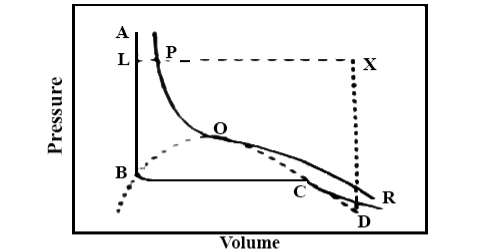
Figure 8: Continuity of State
Another point of a view for the continuity of state is given here. Again, consider Andrews isothermal for a gas, Figure 6. Keeping the volume constant, when the gas is heated the pressure will rise along DX. Now decrease the temperature keeping the pressure constant the volume will decrease along XL.
The point L is on that portion of the isothermal ABCD, which represents the liquid state. Thus, the substance which was gaseous at D has been converted into the liquid at L, but at no time there was more than one phase.
Along the line XL, at P, the gas has turned into liquid. To the left of the critical isotherm PQR it is all liquid but to the right it is gaseous.
The change from the gaseous to the liquid state has been gradual and transition is continuous. There is no sharp transition between liquid and gaseous states in contrast to that observed on melting a solid.
The law of corresponding states introduces a substantial proposition in the treatment of very non-ideal gases. The uniform actions of such gases in terms of the reduced variables should not ambiguous the fact that critical data, which are characteristic of each gas, are inherent in the reduced variables.
Q9) What do you mean by Boyle temperature?
A9)
Boyle temperature can be defined as that particular temperature when real gas starts to behave like an ideal gas at a certain pressure. The temperature at which the second coefficient in the expression becomes zero is known as a Boyle temperature.
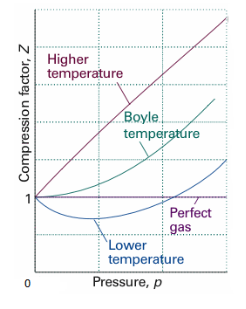
Figure 9: Boyle temperature
The attractive and the repulsive forces acting on a gas particle balanced at Boyle temperature. To calculate the Boyle temperature, the virial equation can be used. Boyle temperature in the terms of the virial coefficients can be written as.

Above figure shows the graph between the pressure p and compressibility factor Z. Boyle temperature is shown in graph. At this point, the real gas starts to behave like an ideal gas. The compression factor Z is given as

Where
Z = Compressibility Factor
Vm = Volume
R = Gas Constant
T = Temperature
p = Pressure
Also, Z=1 for an ideal gas. Whereas Real gases show some deviation.
Q10) What is the Difference between Critical Temperature and Boyle's temperature?
A10)
Critical Temperature is not same as that of Boyle's temperature. At the critical temperature, a gas shows non-ideal behaviour. Critical temperature used to be lower than the Boyle temperature. At Boyle temperature a gas starts to behave like an ideal gas and for ideal gas. The compressibility factor Z is 1 for ideal gas.
Q11) For the following equation of state

Show that
A11)


The last three terms of the equation are very small, except at very high pressures and small volume. Hence substituting v = RT/p.


At p=0, T=TB Boyle temperature


Q12) Discuss Van Der Waals equation of state?
A12)
The most commonly used model of real gas behaviour is the van der Waals gas. This is the simplest real gas model which includes the two crucial ingredients we need:
(i) Intermolecular interactions, as gas molecules attract each other.
(ii) Molecules have non-zero size. Like the ideal gas, the van der Waals gas is only a model to show real behaviour, it is able to describe more of the physical properties exhibited by real gases
The equation of state for a van der Waals gas is

In this equation, the constant a show the strength of the intermolecular interactions, while the constant b describes for the volume excluded owing to the finite size of molecules. If a and b are both set to zero, we will get the equation of state for an ideal gas, pVm = RT.
Moreover, in the low-density limit (when Vm >b and Vm (a/p)1/2) we also obtain the ideal gas behaviour. However, when the density is high, and we try to make Vm approach b, the pressure p shoots up. Thus a/V2m term in the van der Waals model is written.
The equation of state for one mole of van der Waals gas can be rewritten as
 …….. (1)
The point of inflection is given by
 …….. (2)
And
 …….. (3)
From (2)
 …….. (4)
From (3)
 …….. (5)
Equating (4) and (5), we get
 …….. (6)
This gives that V = Vc, where Vc is the critical volume given by
 …….. (7)
Putting this value into eqn (3) gives RT = 8a/27b. As T = Tc The critical temperature is given by
 …….. (8)
Substituting value of Vc and Tc into the equation of state for a van der Waals gas gives the critical pressure pc as p= pc The critical pressure is given by
 …….. (9)
Thus, we have
 …….. (10)
Independent of both a and b. At the critical point,
 …….. (11)
And hence the isothermal compressibility diverges since
 …….. (12)
We have seen that the compressibility κT is negative when T < Tc and so the system is then unstable.
Q13) Find the temperature Tc, pressure pc, and volume Vc at the critical point of a van der Waals gas, and calculate the ratio pcVc/RTc.
A13)
The equation of state for one mole of van der Waals gas can be rewritten as
 …….. (1)
The point of inflection is given by
 …….. (2)
And
 …….. (3)
From (2)
 …….. (4)
From (3)
 …….. (5)
Equating (4) and (5), we get
 …….. (6)
This gives that V = Vc, where Vc is the critical volume given by
 …….. (7)
Putting this value into eqn (3) gives RT = 8a/27b. As T = Tc The critical temperature is given by
 …….. (8)
Substituting value of Vc and Tc into the equation of state for a van der Waals gas gives the critical pressure pc as p= pc The critical pressure is given by
 …….. (9)
Thus, we have
 …….. (10)
Independent of both a and b.
Q14) Discuss Law of Corresponding States?
A14)
For different substances, the strength of the intermolecular interactions and the size of the molecules will vary and hence their phase diagrams will also be different.
However, the size of the molecule’s controls by constant b in the van der Waals model and the strength of the intermolecular interaction’s controls by constant a in the van der Waals model.
For example, the critical temperatures and pressures for different gases are different. However, the phase diagram of substances should be the same when plotted in reduced coordinates, which can be obtained by dividing a quantity by its value at the critical point. Hence, if we replace the quantities p, V, T by their reduced coordinates  ˜,
˜,  ,
,  defined by

Then phase diagrams of materials that are not wholly different from one another should lie on top of each other. This is called the law of corresponding states.
The law of corresponding states gives good results in practice, since the intermolecular potential energies are usually of a similar form in different substances, as shown in Figure.
For small distances there is a repulsive region which is stable minimum at a separation denoted by rmin corresponding to a potential well depth of − , and for larger distances there is a long range attractive region.
For different molecules, the length scale rmin and the energy scale  may be different. But together these two parameters are sufficient to give a reasonable explanation of the intermolecular potential energy.
The parameter rmin sets the scale of the molecular size and the parameter  sets the scale of the intermolecular interactions.
Dividing p, V and T by their values at the critical point removes these scales and allows the different phase diagrams to be superimposed.
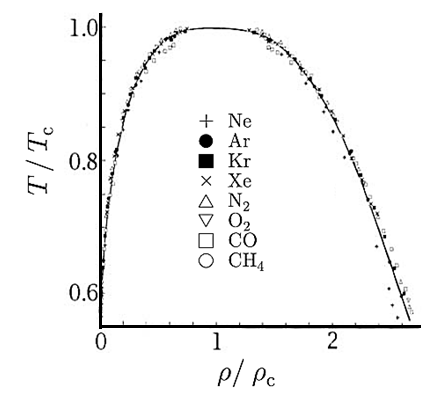
Figure 10: The liquid–gas coexistence for a number of different substances can be superimposed once they are plotted in reduced coordinates. The solid line is a scaling relation.
An example is shown in above Figure. The form of the liquid–gas coexistence is different in detail from that predicted by the van der Waals equation, but shows that the underlying behaviour in different real systems is similar and shows “universal” features.
Q15) Write equation of state of van der Waals gas in reduced coordinates?
A15)
On substituting the reduced coordinates in van der Waals gas equation, we can obtain the result.
Coordinates are given as

The equation of state for a van der Waals gas is

We get

On rearranging

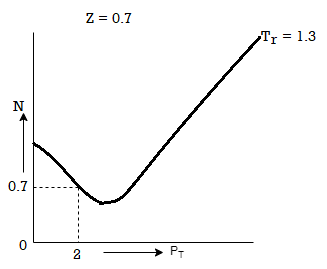
Q16) The gas neon has a molecular weight of 20.183 and its critical temperature, pressure and volume are 44.5K, 2.73MPa and 0.0416m3/kgmol. Reading from a compressibility chart for a reduced pressure of 2 and a reduced temperature of 1.3, the compressibility factor Z is 0.7. What is the corresponding specific volume, pressure, temperature, and reduced volume?
A16)
At pc = 2 and Tc= 1.3 from chart, z = 0.7



Q17) Discuss PV diagram?
A17)
Consider a container filled with gas and sealed tightly. Container is fitted with a movable piston as shown in figure. Work can be done on gas by applying pressure on the piston in downward direction. We can also heat up the gas by placing the container over a flame or submerging it in a bath of boiling water. By doing these processes, the pressure and volume of the gas can change.
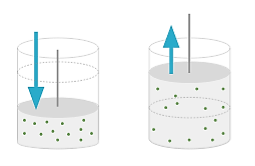
Figure 11: Pressure and volume of the gas
We can visualize these changes in the pressure and volume by P-V diagram. Pressure Volume diagram or PV diagram is a convenient way to visualize these changes. In P-V diagram, Volume is given along x-axis and Pressure is given along y-axis.
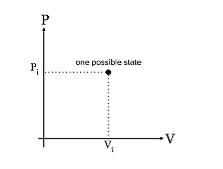
Figure 12: PV diagram
Every point on a PV diagram represents a different state for the gas. As a gas goes through a thermodynamics process, the state of the gas will shift around in the PV diagram, tracing out a path as it moves is given in the diagram below.
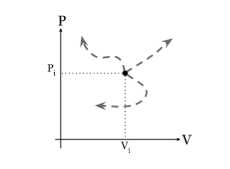
Figure 13: PV diagram
With the help of PV diagram, we can calculate change in internal energy, work done on a gas and heat transferred.
If we apply pressure on the piston in downward direction, there is decrease in the volume of the gas, so the state of the gas must shift to the left toward smaller volumes. Since the gas is being compressed so that mean positive work is being done on the gas.
If we apply pressure on the piston in upward direction, there is increase in the volume of the gas, so the state of the gas must shift to the right toward larger volumes. Since the gas is being expand so that mean negative work is being done on the gas.
This concluded that state shifting to the left on a PV diagram implies work done on the gas was positive whereas state shifting to the right on a PV diagram implies work done on the gas was negative.
The magnitude of work done during a thermodynamic process is equal to the area under the curve in PV diagram.
Work is equal to the area under the curve = W = FΔx = (PA)Δx = P(AΔx) = PΔV
We know that internal energy and temperature are proportional U∝T. So if the temperature increases, the internal energy must also increase.
For ideal gas
PV=NkBT
PV∝T
So
U ∝ T ∝ PV
So, if the quantity of PV increases, the temperature and internal energy UUUU must also increase. Thus, U positive and vice versa happened.
This means that anytime the state in a PV diagram ends up further up and right than where it started, U is a positive number. Similarly, anytime the state in a PV diagram ends up further down and left than where it started, U is a negative number.
Now if the state in the PV diagram moves up and left (pressure increases and volume decreases), or down and right (pressure decreases and volume increases), it is a little ambiguous whether the quantity PV actually increased or decreased (since one variable increased and the other variable decreased). To be sure, one would have to check the exact values of the initial and final P and V on the axes of the graph to tell if the quantity PV actually increased or decreased.
Heat is given by
Q =ΔU - W
If the internal energy increased even though work was done by the gas, that implies that more heat must have entered the gas than energy lost due to the work done by the gas.
If the internal energy decreased even though work was done on the gas, that implies that more heat must have left the gas than energy gained by the gas from work being done on it.
Q18) Discuss Joule experiment?
A18)
Joule expansion shows that the intermolecular interactions in gases lead to deviates from ideal-gas behaviour. Joule expansion is an irreversible expansion of a gas into a vacuum. It can be accomplished by opening a tap which connected the vessel containing gas and an evacuated vessel.
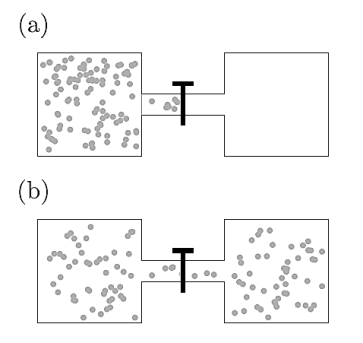
Figure 14: The Joule expansion: (a) before opening the tap and (b) after opening the tap.
The whole system is isolated from its surroundings such that there is so no exchange of heat. Thus, No work is done and the internal energy U remains unchanged.
We will see the behaviour of gas whether the gas warms, cools, or remains at constant temperature in this expansion.
Here we will define the Joule coefficient μJ using

Where the constraint of constant U is relevant for the Joule expansion. This partial differential can be transformed using eqn and the definition of CV to give

Now by the first law of thermodynamics, dU = TdS – pdV, we get

And using a Maxwell relation

And hence

For an ideal gas, p = RT/V, (∂p/∂T)V = R/V , and hence μJ =0.
Hence, as we concluded that the temperature of an ideal gas is unchanged in a Joule expansion. For real gases, you always get cooling because of the attractive effect of interactions. This is because
CV > 0 and (∂U/∂V )T > 0 and so μJ = − (1/CV )(∂U/∂V )T < 0.
This can be explained as
On free expansion of gas into a vacuum, the time-averaged distance between neighbouring molecules increases. The magnitude of the potential energy due to the attractive intermolecular interactions is decreased.
As the interactions are attractive in nature, this result in negative potential energy. Also it is made less negative so in actual the potential energy is increased.
As U must be unchanged in a Joule expansion i.e. there is no heat, intermolecular interactions become repulsive rather than attractive, but at such a density one is probably dealing with a solid rather than a gas enters or leaves and no work is done, the kinetic energy must be decreased by the same amount by which the potential energy increases and hence the temperature falls.
Joule coefficient for a van der Waals gas
p = RT/(V − b) − a/V2

And hence

Q19) A van der Waals gas which undergoes a Joule expansion from volume V1 to volume V2. Calculate the change in temperature for this?
A19)
We know

The temperature change in a Joule expansion from V1 to V2 can be calculated simply by integrating the Joule coefficient as follows


Considering V2 > V1 in an expansion.
Q20) Give an idea of free adiabatic expansion of a perfect gas?
A20)
Consider the adiabatic free expansion of a gas from initial volume Vi to final volume Vf = rVi.
Since the system is not in equilibrium during the free expansion process, the initial and final states do not lie along an adiabat. They do not have the same entropy. We know that Q = W = 0.
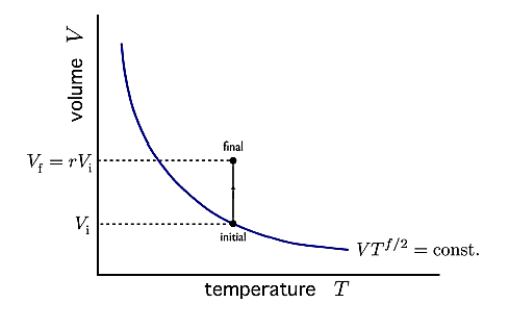
Figure 15: Adiabatic free expansion via a thermal path
We have that Ei = Ef, which means they have the same energy, and, in the case of an ideal gas, the same temperature. Let us assume N is constant. Thus, the initial and final states lie along an isotherm. This is show in in figure.
Now let us compute the change in entropy ΔS = Sf −Si by integrating along this isotherm. It is important to note that the actual dynamics are irreversible and do not quasistatically follow any continuous thermodynamic path.
However, we can use what is a fictitious thermodynamic path as a means of comparing S in the initial and final states.
We have

But from a Maxwell equation, we get


For an ideal gas, the equation of state is pV = NkBT , thus we get

We get

Q21) Discuss Joule- Thomson Porous Plug experiment?
A21)
The Joule expansion is a useful conceptual process. However, for cooling gases this is not of much practical use. On expansion of Gas, it cools down into a second evacuated vessel.
Flow process is needed to cool the gas. Warm gas can be fed into the cooling machine and cold gas emerges from the other end.
James Joule and William Thomson discovered this process and is known as a Joule–Thomson expansion or a Joule–Kelvin expansion.
Consider a steady flow process. At high pressure p1 gas is forced through a throttle valve or a porous plug to a lower pressure p2 as shown in figure.
On the high-pressure side suppose volume is V1. Its internal energy is U1. To push the gas through the restriction work has to be done. High pressure gas behind it does work on it equal to p1V1. The gas expands as it passes through to the low-pressure region and now occupies new volume V2 which is greater than V1.
It has to do work on the low-pressure gas in front of it which is at pressure p2 and hence this work is p2V2. Temperature of the gas gets change in the process. Change in temperature leads to the new internal energy is U2.
The change in internal energy = (U2 − U1)
It is equal to the work done on the gas (p1V1) minus the work done by the gas (p2V2). Thus

Or

Thus, in this flow process enthalpy is conserved.
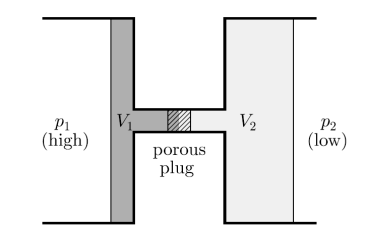
Figure 16: A throttling process
Let us find how gas changes temperature when we reduce its pressure at constant enthalpy. The Joule–Kelvin coefficient is given by

Using the reciprocity theorem this can be transformed and the definition of Cp to give

Now the relation dH = TdS + Vdp implies that

And using a Maxwell relation this becomes

And hence

The change in temperature for a gas from pressure p1 to pressure p2 is given by

Since dH = TdS + Vdp = 0, the entropy change is

And for an ideal gas this is Rln(p1/p2) > 0. Thus, this is an irreversible process.
Temperature of Inversion
Whether the Joule–Kelvin expansion results in heating or cooling is more subtle and in fact μJK can take either sign. It is convenient to consider when μJK changes sign, and this will occur when μJK = 0, i.e., when T(∂V/∂T)p − V = 0, or equivalently
(∂V/∂T)p = V /T
This equation defines the so-called inversion curve in the T–p plane. This is plotted for the van der Waals gas in figure below as a heavy solid line. The lines of constant enthalpy are also shown and their gradients change sign when they cross the inversion curve.
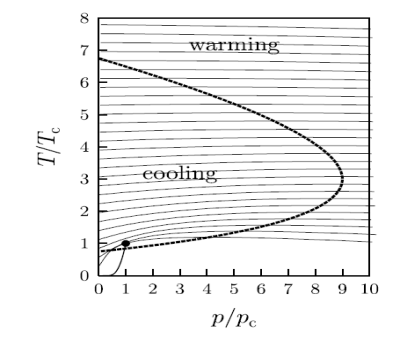
Figure 17: The inversion curve of the van der Waals gas is shown as the heavy dashed line.
When the gradient of the isenthalps on this diagram are positive, then cooling can be obtained when pressure is reduced at constant enthalpy.
A crucial parameter is the maximum inversion temperature. Below inversion temperature the Joule–Kelvin expansion can result in cooling.
In the case of helium, this temperature is 43K. So, helium gas must be cooled to below this temperature by some other means before it can be liquefied using the Joule–Kelvin process.
The isenthalps are lines of constant enthalpy which are shown as thin solid lines. When the gradients of the isenthalps on this diagram are positive, then cooling can be obtained when pressure is reduced at constant enthalpy. Also shown (as a solid line near the bottom left-hand corner of the graph which terminates at the dot) is the line of coexistence of liquid and gas ending in the critical point (p = pc, T = Tc, shown by the dot).