Unit 4
Multivariate Ratio Analysis
Q1) Define multivariate analysis. Also discuss the advantages. 5
A1) Multivariate analysis (MVA) is a Statistical procedure for analysis of data involving more than one type of measurement or observation. It may also mean solving problems where more than one dependent variable is analysed simultaneously with other variables. The measurements are referred to as variables and the objects are called units. Multivariate Analysis helps in summarizing data and reducing the chances of spurious results. Two main multivariate analysis methods are:
- Dependence Analysis – It is used in predicting the dependency among variables. Example: Multiple Regression
- Interdependence Analysis – It is used in analysing the relationships among variables or objects where none of them are dependent. Example : Factor Analysis.
The benefits of multivariate analysis are discussed below-
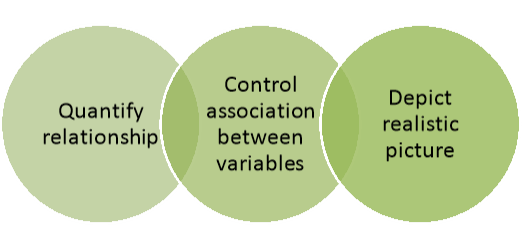
Figure: Advantages of multivariate analysis
- Multivariate techniques allow researchers to look at relationships between variables in an overarching way and to quantify the relationship between variables.
- They can control association between variables by using cross tabulation, partial correlation and multiple regressions, and introduce other variables to determine the links between the independent and dependent variables or to specify the conditions under which the association takes place.
- It able to depict a more realistic picture than looking at a single variable. Further, multivariate techniques provide a powerful test of significance compared to univariate techniques.
Q2) Critically explain the multivariate analysis. 8
A2) Multivariate analysis (MVA) is a Statistical procedure for analysis of data involving more than one type of measurement or observation. It may also mean solving problems where more than one dependent variable is analysed simultaneously with other variables. The measurements are referred to as variables and the objects are called units. Multivariate Analysis helps in summarizing data and reducing the chances of spurious results. Two main multivariate analysis methods are:
- Dependence Analysis – It is used in predicting the dependency among variables. Example: Multiple Regression
- Interdependence Analysis – It is used in analysing the relationships among variables or objects where none of them are dependent. Example : Factor Analysis.
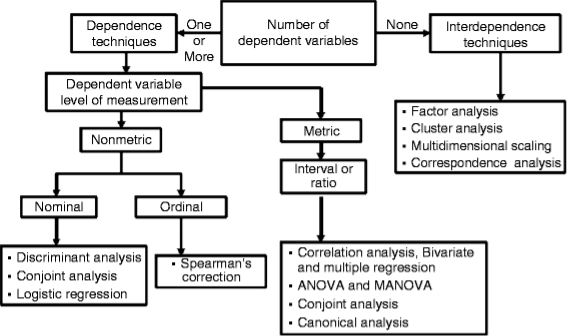
Figure: Overview of multivariate analysis
The limitations of multivariate analysis are as follows-
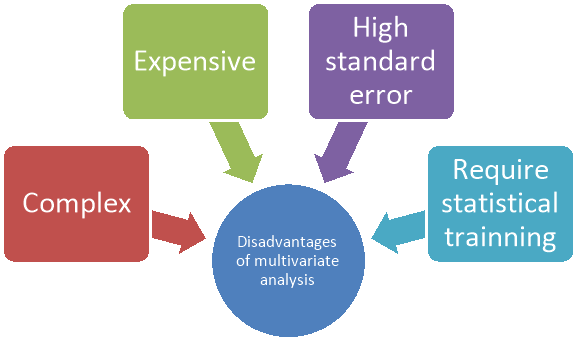
Figure: Disadvantages of multivariate analysis
- Multivariate techniques are complex and involve high level mathematics that required a statistical program to analyse the data.
- These statistical programs can be expensive for an individual to obtain. One of the biggest limitations of multivariate analysis is that statistical modelling outputs are not always easy for students to interpret.
- For multivariate techniques to give meaningful results, they need a large sample of data; otherwise, the results are meaningless due to high standard errors.
- Running statistical programs is fairly straightforward but does require statistical training to make sense of the data.
Q3) Discuss the objectives of multivariate analysis. 5
A3) The objectives of multivariate analysis are discussed below-
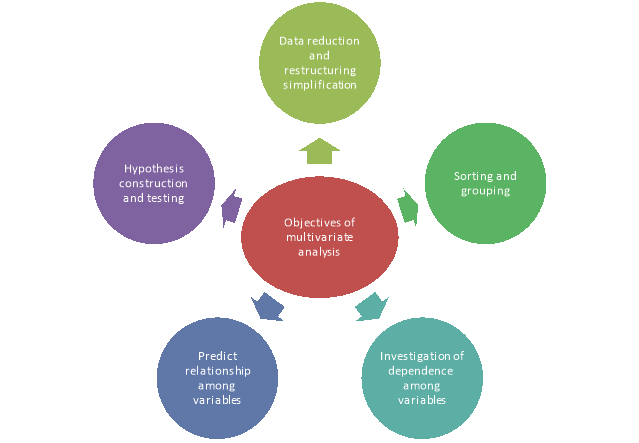
Figure: Objectives of multivariate analysis
(1) Data reduction or structural simplification: This helps data to get simplified as possible without sacrificing valuable information. This will make interpretation easier.
(2) Sorting and grouping: When we have multiple variables, Groups of “similar” objects or variables are created, based upon measured characteristics.
(3) Investigation of dependence among variables: The nature of the relationships among variables is of interest. Are all the variables mutually independent or are one or more variables dependent on the others?
(4) Prediction Relationships between variables: must be determined for the purpose of predicting the values of one or more variables based on observations on the other variables.
(5) Hypothesis construction and testing. Specific statistical hypotheses, formulated in terms of the parameters of multivariate populations, are tested. This may be done to validate assumptions or to reinforce prior convictions.
Q4) Discuss about the usage and limitations of multivariate analysis. 5
A4) The uses of multivariate analysis are as follows-
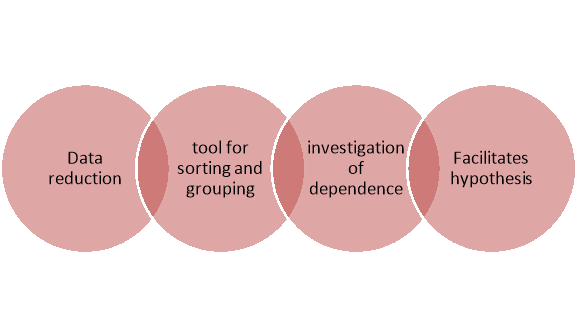
Figure: Usage of multivariate analysis
- It helps in data reduction and structural simplification.
- It is used as tool for sorting and grouping of large data.
- It is used in investigation of the dependence among variables.
- It facilitates prediction of financial position, assets and liabilities of the company.
- It facilitates hypothesis construction and testing of data.
Limitations of Multivariate Analysis
The limitations of multivariate analysis are-
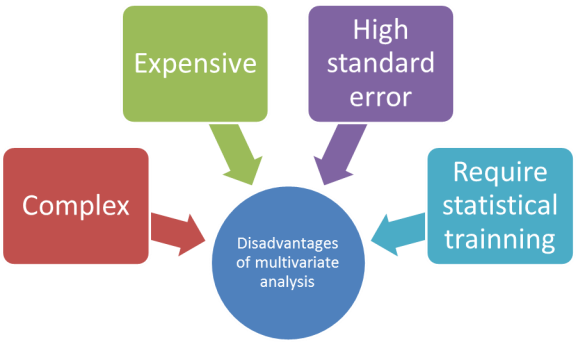
Figure: Disadvantages of multivariate analysis
1. Multivariate techniques are complex and involve high level mathematics that required a statistical program to analyse the data.
2. These statistical programs can be expensive for an individual to obtain. One of the biggest limitations of multivariate analysis is that statistical modelling outputs are not always easy for students to interpret.
3. For multivariate techniques to give meaningful results, they need a large sample of data; otherwise, the results are meaningless due to high standard errors.
4. Running statistical programs is fairly straightforward but does require statistical training to make sense of the data.
Q5) Write any five distinctions between univariate and multivariate analysis. 5
A5) Both univariate and multivariate analysis both are used as tool for financial analysis. The differences between these two concepts are-
Sl no | Univariate analysis | Multivariate analysis |
| A univariate analysis is the most basic type of quantitative analysis. | A multivariate analysis is based on two or more variables within a financial model. |
2. Variable | It is carried out using a single variable | It is carried out using a multiple variable. |
3. Use | Univariate analysis is primarily used at the initial stages, by analysing data that is already available. | Multivariate analysis is used for inferential research, as two or more variables can be unknown or approximated. |
4. Objective | Univariate analysis is usually utilized for descriptive purposes. | Multivariate analysis is aimed towards explanations. |
5. Limitation | The univariate model assumes a business fails when any one of these financial ratios indicate financial difficulty | A multivariate financial analysis can be difficult and costly to run. |
Q6) Discuss about statistical tools used in financial statement analysis. 5
A6) Financial statement are analysed to identify the true financial affairs of the company. Most frequently used techniques of financial statement analysis are discussed below-
- Comparative Statements (horizontal analysis): These are the statements depicting the financial position and profitability of an enterprise for the distinct timeframe in a comparative form to give a notion about the position of 2 or more periods. It usually applies to the 2 important financial statements, namely, statement of profit and loss and balance sheet outlined in a comparative form. Comparative figures signify the direction and trend of financial position and operating outcomes. This type of analysis is also referred to as ‘horizontal analysis’.
- Common Size Statements (Vertical Analysis): Common size statements are the statements which signify the association of distinct items of a financial statement with a generally known item by depicting each item as a % of that common item. Such statements allow an analyst to compare the financing and operating attributes of 2 enterprises of distinct sizes in a similar industry. This analysis is also referred to as ‘Vertical analysis’.
- Cash Flow Analysis: It refers to the analysis of the actual movement of cash into and out of an establishment. The flow of cash into the trading concern is called cash inflow or positive cash flow and the flow of cash out of the enterprise is known as negative cash flow or cash outflow. The difference between the outflow and inflow of cash is the net cash flow. Hence, it compiles the reasons for the changes in the cash position of a trading concern between dates of 2 balance sheets.
- Ratio Analysis: It characterizes the vital association which exists between several items of a B/S (balance sheet) and a statement of P&L of an enterprise. As a method of financial analysis, accounting ratios compute the comparative importance of the single items of the position and income statements. It is feasible to evaluate the solvency, efficiency, and profitability of an enterprise via the method of ratio analysis.
- Trend Analysis: Trend analysis is used to reveal the trend of items with the passage of time and is generally used as a statistical tool. Trend analysis is used in conjunction with ratio analysis, horizontal and vertical analysis to spot a particular trend, explore the causes of the same and if required prepare future projections.
- Regression Analysis: Regression analysis is a statistical tool used to establish and estimate relationship among variables. Generally, the dependent variable is related to one or more independent variables. In case of financial statement analysis, the dependent variable may be, say, sales, and it is required to estimate its relationship with the independent variable, say, a macroeconomic factor like Gross Domestic Product.
- Graphical Analysis: Graphs provide visual representation of the performance that can be easily compared over time. The graphs may be line graphs, column graphs or pie charts.
Q7) What is multivariate analysis? How it create problems in analysing financial statement. 8
A7) Multivariate analysis (MVA) is a Statistical procedure for analysis of data involving more than one type of measurement or observation. It may also mean solving problems where more than one dependent variable is analysed simultaneously with other variables. The measurements are referred to as variables and the objects are called units. Multivariate Analysis helps in summarizing data and reducing the chances of spurious results. Two main multivariate analysis methods are:
- Dependence Analysis – It is used in predicting the dependency among variables. Example: Multiple Regression
- Interdependence Analysis – It is used in analysing the relationships among variables or objects where none of them are dependent. Example : Factor Analysis.
The limitations of multivariate analysis are as follows-
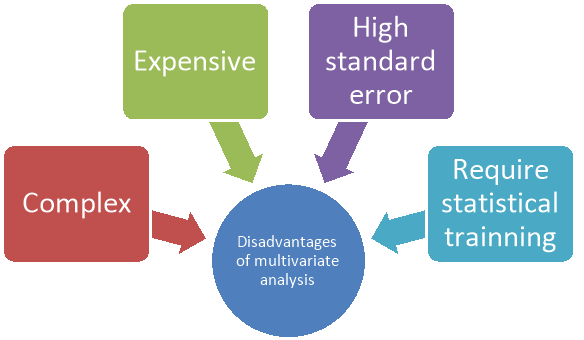
Figure: Disadvantages of multivariate analysis
- Multivariate techniques are complex and involve high level mathematics that required a statistical program to analyse the data.
- These statistical programs can be expensive for an individual to obtain. One of the biggest limitations of multivariate analysis is that statistical modelling outputs are not always easy for students to interpret.
- For multivariate techniques to give meaningful results, they need a large sample of data; otherwise, the results are meaningless due to high standard errors.
Running statistical programs is fairly straightforward but does require statistical training to make sense of the data.
Q8) Discuss about the limitations of financial statement. 10
A8) The limitations of financial statements are discussed below-
- Historical Costs
Financial reports depend on historical costs. All the transactions record at historical costs; The value of the assets purchased by the Company and the liabilities it owes changes with time and depends on market factors; The financial statements do not provide the current value of such assets and liabilities. Thus, if a large number of items available in the financial statements based on historical costs and the Company has not re-valued them, the statements can be misleading.
2. Inflation Adjustments
The assets and liabilities of the Company are not inflation-adjusted. If the inflation is very high, the items in the reports will be recorded at lower costs and hence, not giving much information to the readers.
3.Personal Judgments
The financial statements are based on personal judgments. The value of assets and liabilities depends on the accounting standard used by the person or group of persons preparing them. The depreciation methods, amortization of assets, etc. are prone to the personal judgment of the person using those assets. All such methods cannot be stated in the financial reports and are, therefore, a limitation.
4.Specific Time Period Reporting
The financial statements based on a specific time period; they can have an effect of seasonality or sudden spike/dull in the sales of the Company. One period cannot be compared to other periods very easily as many parameters affect the performance of the Company, and that reported in the financial reports. A reader of the reports can make mistakes while analyzing based on only one period of reporting. Looking at reports from various periods and analyzing them prudently can give a better view of the performance of the Company.
- Intangible Assets
The intangible assets of the Company are not recorded on the balance sheet. Intangible assets include brand value, the reputation of the Company earned over a while, which helps it generate more sales, is not included in the balance sheet. However, if the Company has done any expense on intangible assets, it is recorded on the financial statements. It is, in general, a problem for start-ups which, based on the domain knowledge, creates a huge intellectual property, but since they have not been in business for long could not generate enough sales. Hence, their intangible assets are not recorded on the financial statements and neither reflected in the sales.
2. Comparability
While it is a common practice for analysts and investors to compare the performance of the Company with other companies in the same sector, but they are not usually comparable. Due to various factors like the accounting practices used, valuation, personal judgments made by the different people in different Companies, comparability can be a difficult task.
3. Fraudulent Practices
The financial statements are subject to fraud. There are many motives behind having fraudulent practices and thereby skewing the financial results of the Company. If the management is to receive a bonus or the promoters would like to raise the price of the share, they tend to show good results of the Company’s performance by using fraudulent accounting practices, creating fraud sales, etc. The analysts can catch these if the Company’s performance exceeds the industry norms.
4. No Discussion on Non-Financial Issues
Financial statements do not discuss non-financial issues like the environment, social and governance concerns, and the steps taken by the Company to improve the same. These issues are becoming more relevant in the current generation, and there is an increased awareness amongst the Companies and the government. However, the financial reports do not provide such information/discussion.
9. It May Not be Verified
An auditor should audit the financial statements; however, if they are not, they are of minimal use to the readers. If no one has verified the accounting practices of the Company, operations, and general controls of the Company, there will be no audit opinion. An audit opinion that accompanies the financial statements highlights various financial issues (if any) in the reports.
10. Future Prediction
Although many financial statements have a comment that these contain the forward-looking statement, however, no prediction about the business could be made using these statements. The financial statements provide the historical performance of the Company; many analysts use this information and predict the sales and profit of the Company in future quarters. However, it is prone to many assumptions. Thus, financial statements as a standalone cannot provide any prediction on the future performance of the Company.
Q9) Define the concept of schedule. Discuss the types of schedules. 8
A9) In accounting, a schedule is defined as the supporting report or document which constitutes detailed information, explaining the elements of the chief financial report. It serves as a kind of proof to all the data that is presented in the financial report, with answers to all the numbers mentioned in the report. In other words, accounting schedules provide all the financial accounting in detail which cannot be illustrated within the chief report. For example, if we talk about the schedule of the balance sheet, not only the liabilities, assets, and equities of a company will be presented, but a breakdown of each category will be shared as a sub-category or a sub-schedule. A schedule is a supporting document that provides additional details or proof for the information stated in a primary document. In business, schedules are needed to provide proof for the ending balances stated in the general ledger, as well as to provide additional detail for contracts. Examples of schedules are:
A list of the aged accounts payable
A list of the aged accounts receivable
An itemization of all fixed assets and their associated accumulated depreciation
An itemization of all inventory and their associated costs
Types of Accounting Schedules
The accounting world constitutes a lot of financial terms which have different meanings and executions. These terms together lay the foundation for financial reporting and serve as the basis for the various types of accounting schedules discussed herein.
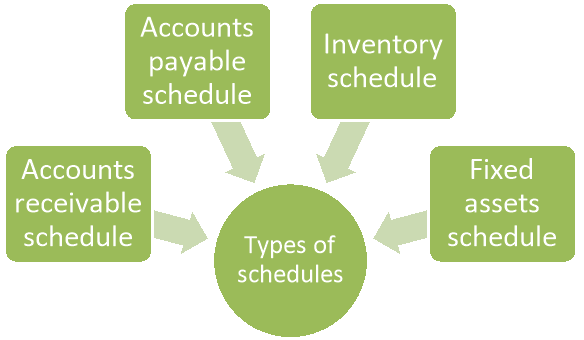
Figure: Types of schedules
5. Accounts Receivable Schedule
The accounts receivable schedule lets you know about the payments which others have to pay to your company in exchange for your products and services which were consumed by them. This easily lets you know which customers have outstanding invoices as the invoices are collaboratively assigned to every single customer. With this report, you will know if you need to schedule a collection call or reduce the ‘credit extended’ in case a customer has not paid you yet for your services. For example, businesses can generate payment notices to the customers with unpaid invoices after simply cross-verifying the list of such customers with the help of this schedule.
6. Accounts Payable Schedule
The accounts payable schedule lists the number of vendors to whom your company have payments pending. If your business buys services and raw materials from a lot of different companies, there is a good amount of possibility that your business gets offered terms, with cash not forming the only source of payments. For example, the debts which are outstanding are actually a liability on a business which must be paid as soon as possible. This schedule precisely tells you about how much money is to be paid and to whom. In other words, it is one of the best ways to arrive at the accounts payable solutions.
7. Inventory Schedule
The inventory schedule lets you know about the raw materials that are available for use for manufacturing and the number of ready-to-sale products to the customers. The complete costs of all these things form the inventory, which is considered as an asset to the company. Any revenues that come as a result of incurred costs while providing a service also come under the inventory. The distribution details of the inventories will be shown in this schedule. In a nutshell, inventory accounting is comprised of the following:
Raw Materials- Materials available for the finished goods manufacturing
Working Materials-Materials that are presently in use for goods manufacturing
Finished Goods-Finished goods that are ready for sale to the customers
8. Fixed Asset Schedule
The fixed asset schedule comprises of the fixed assets listing in detail, which is mentioned in the general ledger. In exact terms, this schedule will let you know about the particular asset number, gross cost, description, and accumulated depreciation. Accumulated depreciation is defined as the complete fixed asset depreciation, which is ‘expense charged’ owing to its acquisition and availability for use. The accumulated depreciation account is an account for the assets which are having a credit balance i.e. it appears as a deduction from the total fixed assets amount reported on the balance sheet.
Q10) Define cash flow statement. Also discuss its benefits. 8
A10) Cash flows from financing (CFF) is the last section of the cash flow statement. The section provides an overview of cash used in business financing. It measures cash flow between a company and its owners and its creditors, and its source is normally from debt or equity. These figures are generally reported annually on a company's 10-K report to shareholders. Analysts use the cash flows from financing section to determine how much money the company has paid out via dividends or share buybacks. It is also useful to help determine how a company raises cash for operational growth. Cash obtained or paid back from capital fundraising efforts, such as equity or debt, is listed here, as are loans taken out or paid back. When the cash flow from financing is a positive number, it means there is more money coming into the company than flowing out.
Benefits of cash flow statement
Some of the advantages of Cash flow statement
- Verifying Profitability and Liquidity Positions
Cash Flow Statement helps the management to ascertain the liquidity and profitability position of businesses. Liquidity refers to one’s ability to pay the obligation as soon as it becomes due. Since Cash Flow Statement presents the cash position of a firm at the time of making payment it directly helps to verify the liquidity position, the same is applicable for profitability.
2. Verifying Capital Cash Balance
Cash Flow Statement also helps to verify the capital cash balance of businesses. It is possible for businesses to verify the idle and/or excess and/or shortage of cash position, if capital cash balance is determined. After verifying the cash position, the management can invest the excess cash, if any, or borrow funds from outside sources accordingly to reach the cash loss.
3. Cash Management
If the Cash Flow Statement is properly prepared, it becomes easy for you to manage the cash. The management can prepare an estimate about the multiple inflows of cash and outflows of cash so that it becomes very helpful for them to make future plans.
4. Planning and Coordination
Cash Flow Statement is planned on an estimated basis meant for the successive year. This helps the management to understand how much funds are needed and for what purposes, how much cash is generated from internal sources, how much cash can be procured from outside the business. It also helps to prepare cash budgets. Thus, the management can coordinate various activities and prepare plans with the help of this statement.
5. Superiority over Accrual Basis of Accounting
As a number of technical adjustments are made in the latter case, Cash Flow Statement is more reliable or dependable than collecting basis of accounting.