Unit - 3
Volumes by slicing
Q1) What do you understand by the solid of revolution?
A1)
A solid of revolution is a solid that is generated by revolving a plane region about a line that lies in the same plane as the region; the line is called the axis of revolution.
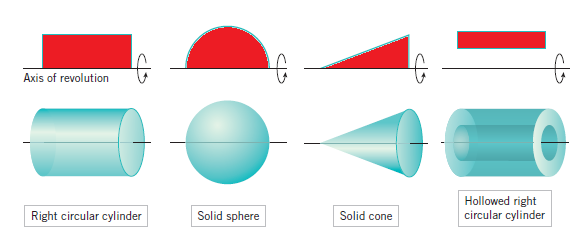
Q2) How do we find volumes by discs perpendicular to the x-axis?
A2)
Let f be continuous and nonnegative on [a, b], and let R be the region that is bounded above by y = f(x), below by the x-axis, and on the sides by the lines x = a and x = b . Find the volume of the solid of revolution that is generated by revolving the region R about the x-axis.
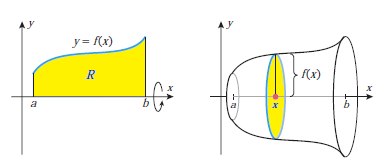
We can solve this problem by slicing. For this purpose, observe that the cross section of the solid taken perpendicular to the x-axis at the point x is a circular disk of radius f(x) (see second figure above). The area of this region is

We get

Because the cross sections are disk shaped, the application of this formula is called the
Q3) Find the volume of the solid that is obtained when the region under the curve y =√x over the interval [1, 4] is revolved about the x-axis
A3)
As we know that, the volume is


Q4) Derive the formula for the volume of a sphere of radius r.
A4)
A sphere of radius r can be generated by revolving, the upper semicircular disk enclosed between the x-axis and

About the x-axis. Since the upper half of this circle is the graph of y = f(x) =  the volume of the sphere is-

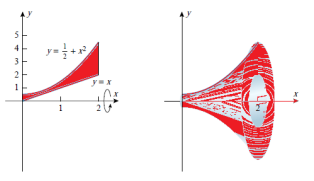
Q5) Find the volume of the solid generated when the region between the graphs of the equations f(x) =  and g(x) = x over the interval [0, 2] is revolved about the x-axis.
A5)
First we draw the region and then imagine we revolve it about the x-axis, then the volume-


Q6) Volume by discs and washers perpendicular to the y-axis.
A6)
Using the method of slicing and Formula, we would be able to deduce the following formulas for the volumes of the solids as-


Q7) Find the volume of the solid generated when the region enclosed by y = √x, y = 2, and x = 0 is revolved about the y-axis.
A7)
First sketch the region and the solid. The cross sections taken perpendicular to the y-axis are disks, so we will apply (V for disks). But first we must rewrite y = √x as x =  . Thus from the equation above with u(y) =
  , the volume is

Q8) Find the volume of the solid generated when the region under the curve y = x2 over the interval [0, 2] is rotated about the line y = −1.
A8)
At each x in the interval 0 ≤ x ≤ 2, the cross section of the solid perpendicular to the axis y = −1 is a washer with outer radius x2 + 1 and inner radius 1. Since the area of this washer is

The volume of the solid is

Q9) Use cylindrical shells to find the volume of the solid generated when the region enclosed between y = √x, x = 1, x = 4, and the x-axis is revolved about the y-axis.
A9)
Since f(x) = √x, a = 1, and b = 4, then

Q10) Use cylindrical shells to find the volume of the solid generated when the region R in the first quadrant enclosed between y = x and y =  is revolved about the y-axis.
A10)
At each x in [0, 1] the cross section of R parallel to the y-axis generates a cylindrical surface of height x − and radius x. Since the area of this surface is
 x −
x −
The volume of the solid is

Q11) Use cylindrical shells to find the volume of the solid generated when the region R under y =  over the interval [0, 2] is revolved about the line y = −1.
A11)
At each y in the interval 0 ≤ y ≤ 4, the cross section of R parallel to the x-axis generates a cylindrical surface of height 2 −√y and radius y + 1. Since the area of this surface is
2π(y + 1)(2 −√y)
It follows that the volume of the solid is

Q12) Graph the parametric curve
x = 2t − 3, y= 6t – 7
By eliminating the parameter, and indicate the orientation on the graph.
A12)
To eliminate the parameter we will solve the first equation for t as a function of x, and then substitute this expression for t into the second equation:


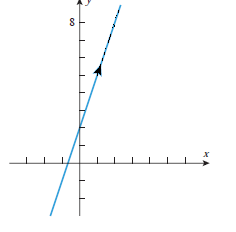
y = 3x + 2
Thus, the graph is a line of slope 3 and y-intercept 2. To find the orientation we must look to the original equations; the direction of increasing t can be deduced by observing that x increases as t increases or by observing that y increases as t increases. Either piece of information tells us that the line is traced left to right as shown in Figure
Q13) What do you understand by the tangent lines to parametric curves?
A13)
We will be concerned with curves that are given by parametric equations
x = f(t), y = g(t)
In which f(t) and g(t) have continuous first derivatives with respect to t. It can be proved that if dx/dt  0, then y is a differentiable function of x, in which case the chain rule implies that

This formula makes it possible to find dy/dx directly from the parametric equations without eliminating the parameter.
Q14) Find the slope of the tangent line to the unit circle x = cos t, y = sint (0 ≤ t ≤ 2π) at the point where t = π/6
A14)
The slope at a general point on the circle is

Thus, the slope at t = π/6 is


Q15) Find the area under the curves where f(x) = x+4 and g(x) = 3 – x/2 over the interval [1,4]
A15)
Here limits are given a = 1 , b = 4,
We know that, area under the curve,
A = 
= 
= 
= 
= (16 – 7/4) = 57/4
So that the area of the region is 57/4 unit square.
Q16) let f(x) = 2 x³/² ,then calculate the arc length of the graph over interval [ 0 , 1].
A16)
Here we can find its first derivative
f’(x) = 3 x¹/²
Such that,
[f’(x)]² = 9x
Then we know that,
Length of Arc =
= 
Now,
Let u = 1 + 9x , then du = 9 dx , when x = 0 then u = 1 and x = 1 then u = 10,
So,
= 
= 
= 1/9 ×2/3 ×  = 2.268 units
Q17) Find the length of f(x) = x between x = 2 and x = 3.
A17)
The derivative of f(x) will be,
f’(x) = 1
And we know that,
Length of Arc =
So that,
Length of Arc =
= 
On solving the integral, we get
= (3 – 2) =
=  .
.
Q18) Find the circumference of a circle of radius a from the parametric equations x = a cos t, y = a sint (0 ≤ t ≤ 2π)
A18)
We know that


Q19) Find the volume of the solid of revolution formed by revolving R around y-axis of the function f(x) = 1/x over the interval [1 , 3].
A19)
The graph of the function f(x) = 1/x will look like-
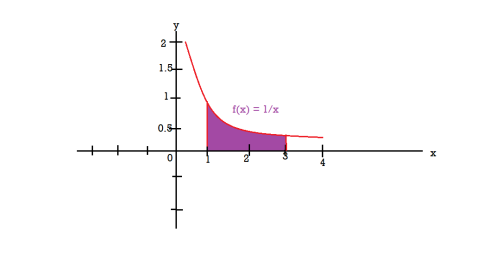
The volume of the solid of revolution generated by revolving R(violet region) about the y-axis over the interval [1 , 3]
Then the volume of the solid will be-


Q20) Sketch the graph of  in polar coordinates.
A20)
Here d = 2 and e = 1. Thus, the graph is a parabola with the focus at the pole and the directrix 2 units to the left of the pole. This tells us that the parabola opens to the right along the polar axis and p = 1.
All of the important geometric information about an ellipse can be obtained from the values of a, b, and c in Figure below. One way to find these values from the polar equation of an ellipse is based on finding the distances from the focus to the vertices. As shown in the figure, let r0 be the distance from the focus to the closest vertex and r1 the distance to the farthest vertex. Thus,
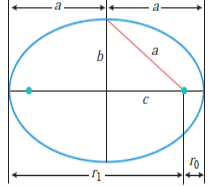

From which it follows that

Moreover, it also follows that

Thus
