Unit - 1
Probability
Q1) What is probability?
A1)
Suppose there are ‘n’ exhaustive cases in a random experiment which is equally likely and mutually exclusive.
Let ‘m’ cases are favourable for the happening of an event A, then the probability of happening event A can be defined as-

Probability of non-happening of the event A is defined as-

Note- Always remember that the probability of any events lies between 0 and 1.

Q2) A box contains 4 white and 2 black balls and a second box contains three balls of each colour. Now a bag is selected at random and a ball is drawn randomly from the chosen box. Then what will be the probability that the ball is white.
A2)
Here we have two mutually exclusive cases-
1. The first bag is chosen
2. The second bag is chosen
The chance of choosing the first bag is 1/2. And if this bag is chosen then the probability of drawing a white ball is 4/6.
So that the probability of drawing a white ball from first bag is-

And the probability of drawing a white ball from second bag is-

Here the events are mutually exclusive, then the required probability is-
Q3) A die is rolled. If the outcome is a number greater than three. What is the probability that it is a prime number.
A3)
The sample space is- S = {1, 2, 3, 4, 5, 6}
Let A be the event that the outcome is a number which is greater than three and B be the event that it is a prime.
So that-
A = {4, 5, 6} and B = {2, 3, 5} and hence 
P(A) = 3/6, P(B) = 3/6 and 
Now the required probability-


Q4) What is conditional probability?
A4)
Let A and B be two events of a sample space Sand let  . Then conditional probability of the event A, given B, denoted by
 is defined by –

Theorem: If the events A and B defined on a sample space S of a random experiment are independent, then

Q5) Three urns contain 6 red, 4 black; 4 red, 6 black; 5 red, 5 black balls respectively. One of the urns is selected at random and a ball is drawn from it. If the ball drawn is red find the probability that it is drawn from the first urn.
A5)
 : The ball is drawn from urn I.
 : The ball is drawn from urn II.
 : The ball is drawn from urn III.
R: The ball is red.
We have to find 

Since the three urns are equally likely to be selected

Also,


From (i), we have

Q6) What do you understand by independence of events?
A6)
Two events A, B ∈ are statistically independent iff

(Two disjoint events are not independent.)
Independence implies that

Knowing that outcome is in B does not change your perception of the outcome’s being in A.
Q7) An urn  contains 3 white and 4 red balls and an urn lI contains 5 white and 6 red balls. One ball is drawn at random from one ofthe urns and isfound to be white. Find the probability that it was drawn from urn 1.
A7)
Let  : the ball is drawn from urn I
 : the ball is drawn from urn II
 : the ball is white.
We have to find 
By Bayes Theorem
 ... (1)
Since two urns are equally likely to be selected,  (a white ball is drawn from urn
  )
) 
 (a white ball is drawn from urn II)
From(1), 
Q8) ln a bolt factory machines  and
and  manufacturerespectively 25%, 35% and 40% of the total. Lf their output 5, 4 and 2 per cent are defective bolts. A bolt is drawn at random from the product and is found to be defective. What is the probability that it was manufactured by machine B.?
A8)
Bolt is manufactured by machine 
 : bolt is manufactured by machine
 : bolt is manufactured by machine

The probability of drawing a defective bolt manufactured by machine  is
is  (D/A)
(D/A) 
Similarly,  (D/B)
(D/B)  and
and  (D/C)
(D/C) 
By Baye’s theorem


Q9) What is a discrete random variable?
A9)
By definition a random variable X and its distribution are discrete if X assumes only finitely maany or at most contably many values  called the possible values of X. With positive probabilities
  is zero for any interval J containing no possible values.
Clearly the discrete distribution of X is also determined by the probability functions f (x) of X, defined by

From this we get the values of the distribution function F (x) by taking sums.

Discrete Probability Distributions
Each event in a sample space has certain probability (or chance) of occurrence (or happening). A formula representing all these probabilities which a discrete random variable assumes, is known as the discrete probability distribution.
Discrete probability distribution, probability function or probability mass function of a discrete random variable X is the function f (x) satisfying the following conditions:


Thus probability distribution is the set of ordered pairs (x, f (x)), i.e., outcome x and its probability (chance) f (x). Cumulative distribution or simply distribution of a discrete random variable X is F (x) defined by

It follows that,

Q10) What do you understand by probability density function?
A10)
Suppose f( x ) be a continuous function of x . Suppose the shaded region ABCD shown in the following figure represents the area bounded by y = f( x ), x –axis and the ordinates at the points x and x + δx , where δx is the length of the interval ( x , x + δx ).If δx is very-very small, then the curve AB will act as a line and hence the shaded region will be a rectangle whose area will be AD × DC this area = probability that X lies in the interval ( x, x +δx )
= P[ x≤ X ≤ x +δx ]
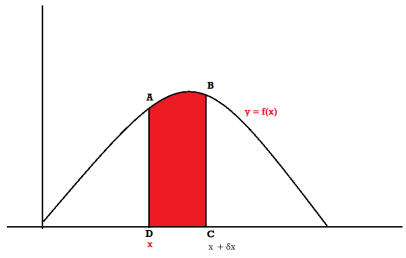
Hence,


Q11) The pdf of a continuous random variable is given as below-

Then find the c.d.f. Of X.
A11)
The c.d.f. Of X will be given by-


Hence the c.d.f will be-


Q12) What are bivariate random variables?
A12)
Let X and Y be two discrete random variables defined on the sample space S of a random experiment then the function (X, Y) defined on the same sample space is called a two-dimensional discrete random variable. In other words, (X, Y) is a two-dimensional random variable if the possible values of (X, Y) are finite or countably infinite. Here, each value of X and Y is represented as a point ( x, y ) in the xy-plane.
Joint probability mass function-
Let (X, Y) be two-dimensional discrete random variables with each possible outcome  , we associate a number
  representing-

And satisfying the given conditions-

The function p defined for all  is called joint probability mass function of X and Y.
Q13) Let  be two independent N(0,1) random variables. Define


Where  is a real number in (-1,1)
a. Show that X and Y are bivariate normal.
b. Find the joint PDF of X and Y.
c. Find  (X,Y)
(X,Y)
A13)
First, note that since  are normal and independent, they are jointly normal with the joint PDF


We need to show aX+bY is normal for all  we have


 and thus it is normal.
 We can use the methods of transformations (Theorem 5.1) to find the joint PDF of X and Y . The inverse transformation is given by


Thus we conclude that,


 To find
  , first mode


Therefore,


Q14) What do you understand by joint probability density function?
A14)
Let S be a sample space associated with a random experiment ε. Let X = X(s) and Y = Y (s) be two random variables on the same sample space S. The two real valued functions X(s) and Y (s) each assign a real number to each outcome s of the sample space S, with respective image sets given by X(s) = {X(s1), X(s2 ), . . . , X(sn)}={X1, X2 , . . . , Xn} and Y (s) = {Y (s1), Y (s2 ), . . . , Y (sm)}={Y1, Y2 , . . . , Ym}
Here the two random variables X and Y are discrete since the possible values of X and Y are finite (or countably infinite).
Example:
a. X: Age, Y : Blood pressure of a person.
b. X: Crop yield, Y : Rain fall in an area.
c. X: I.Q., Y : Nutrition of an individual.
Consider the product set
X(S) × Y (S) = {(x1, y1), (x1, y2 ), . . . , (xn, ym)} .
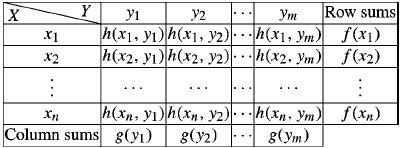
The joint probability distribution or joint distribution or probability mass function or joint probability function of two discrete random variables
X and Y is a function h(x, y) difined on the product set X(s) × Y (s) assigning probability to each of the ordered pairs (xi , yi ).
Thus h(xi , yi ) = P(X = xi , Y = yj ) gives the probability for the simultaneous occurrences of the outcomes xi and yi . Further h(x, y) satisfies the following:


The set of triplets (xi , yj , h(xi , yj )) for i = 1 to n, j = 1 to m, known as the probability distribution of the two random variables X, Y is in general represented in the form of a rectangular table as follows:
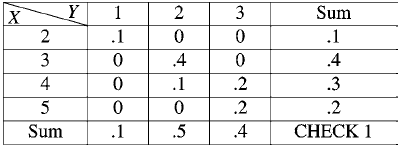
Q15) Two cards are selected at a random from a box which contains five cards numbered 1, 1, 2, 2 and 3. Find the joint distribution of X and Y where X denotes the sum and Y, the maximum of the two numbers drawn.
A15)
The possible pair of numbers are (1,1),
(1,1), (1,2), (2,1), (1,2), (2,1), (1,3), (3,1), (2,2), (2,3), (3,2). Sum of two numbers are 2, 3, 4, 5 while maximum numbers are 1, 2, 3. Thus
Distribution of X is

Distribution of Y is

Joint distribution is
Q16) Find the joint distribution of X and Y, which are independent random variables with the following respective distributions:
 | 1 | 2 |
P [ X =  | 0.7 | 0.3 |
And
 | -2 | 5 | 8 |
P [ Y =  | 0.3 | 0.5 | 0.2 |
A16)
Since X and Y are independent random variables,

Thus the entries of the joint distribution are the products
Of the marginal entries

Q17) Find-
(a) Marginal distributions
(b) E(X) and E(Y )
(c) Cov (X, Y )
(d) σX , σY and
(e) ρ(X, Y )
For the following joint probability distribution-
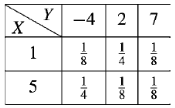
A17)
(a) Marginal distributions
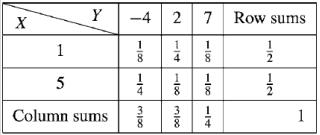
The marginal distribution of x
X | 1 | 5 |
p(x) | 1/2 | 1/2 |
The marginal distribution of Y-
Y | -4 | 2 | 7 |
p(y) | 3/8 | 3/8 | ¼ |
(b) E(X) and E(Y )
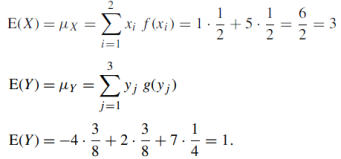
(c) Cov (X, Y )
As we know that-

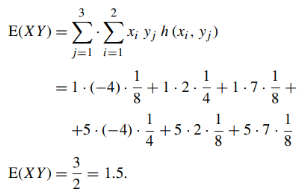

= -1.5
(d) σX , σY and
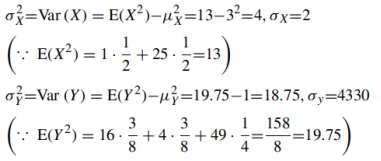
(e) ρ(X, Y )

Q18) A die is tossed. If the number is odd, what is the probability that it is prime?
A18)
2, 4, 6, are even, 1, 3, 5 are three odd numbers, of which two are prime numbers (namely
3 and 5) Conditional probability is w.r.t. The reduced sample space of odd numbers only. Thus
P (Prime given odd) = P (P /O) = 2/3
Q19) A box contains 9 tickets numbered 1 to 9 inclusive. If 3 tickets are drawn from the box one at a time, find the probability they are alternatively either odd, even, odd or even, odd, even.
A19)
4 even numbers = {2, 4, 6, 8},
5 odd numbers = {1, 3, 5, 7, 9}.
Let e denote even and o denote odd number
P (oeo or eoe) = P (oeo) + P (eoe)
Since oeo and eoe are mutually exclusive. Now
Prob(odd and even and odd) = P (odd) P (even/given
Odd) P (odd/given odd and even)
P (oeo) = P (o)P (e/o)P (o/oe) = 5/9. 4/8 . 4/7 = 10/63
Similarly,
P (eoe) = P (e)P (o/e)P (e/eo)
P (eoe) = 4/9 . 5/8 . 3/7 = 5/42
So P (oeo or eoe) = 10/63 + 5/ 42 = 5/18
Q20) What do you understand by a frequency distribution?
A20)
When observations, whether they are discrete or continuous, available on a single characteristic of a large number of individuals, it becomes necessary to condense the data as far as possible without loosing any information of interest.
Let us consider the blood group of the several people,
A, B, O, AB, A, A, O, O, O, A, AB, A, AB, B
This presentation of the data is not considered as good since for large number of observations it is not easy to handle the data in this form.
Group | Frequency | Tally marks |
A | 5 |
|
B | 2 | II |
O | 4 | IIII |
AB | 3 | III |
Total | 14 |
|
Discrete Frequency Distribution
A frequency distribution in which the information is distributed in different classes on the basis of a discrete variable is known as discrete frequency distribution.
Continuous Frequency Distribution
A distribution in which the information is distributed in different classes on the basis of a continuous variable is known as continuous frequency distribution.
Relative Frequency Distribution
A relative frequency corresponding to a class is the ratio of the frequency of that class to the total frequency. The corresponding frequency distribution is called relative frequency distribution. If we multiply each relative frequency by 100, we get the percentage frequency corresponding to that class and the corresponding frequency distribution is called “Percentage frequency distribution”.
Cumulative Frequency Distribution
The cumulative frequency of a class is the total of all the frequencies up to and including that class. A cumulative frequency distribution is a frequency distribution which shows the observations ‘less than’ or ‘more than’ a specific value of the variable.
The number of observations less than the upper class limit of a given class is called the less than cumulative frequency and the corresponding cumulative frequency distribution is called less than cumulative frequency distribution.
Q21) What is the frequency polygon?
A21)
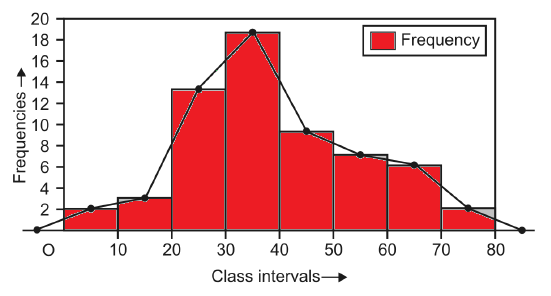
In order to draw the graph of a frequency polygon, first of all the mid values of all the class intervals and the corresponding frequencies are plotted as points with the help of the rectangular co-ordinate axes. Secondly, we join these plotted points by line segments. The graph thus obtained is known as frequency polygon, but one important point to keep in mind is that whenever a frequency polygon is required we take two imaginary class intervals each with frequency zero, one just before the first class interval and other just after the last class interval. Addition of these two class intervals facilitate the existence of the property that
Area under the polygon = Area of the histogram
For example, if we take the frequency distribution as given in Table 15.2 then, we have to first plot the points (5, 2), (15, 3), …, (75, 2) on graph paper along with the horizontal bars. Then we join the successive points (including the mid points of two imaginary class intervals each with zero frequency) by line segments to get a frequency polygon. The frequency polygon for frequency distribution given in Table of above example:
Q22) Define population, parameter and sample.
A22)
Statistical methods are used to study a process by analyzing the data, discrete or continuous, recorded as either numerical value or a descriptive representation to improve the “quality” of the process. Thus statistician is mainly concerned with the analysis of data about the characteristics of persons or objects or observations.
POPULATION AND SAMPLE
Population is the set or collection or totality of objects, animate or inanimate, actual or hypothetical, under study. Thus mainly population consists of sets of numbers, measurements or observations which are of interest.
Size
Size of the population N is the number of objects or observations in the population.
Population is said to be finite or infinite depending on the size N being finite or infinite.
Since it is impracticable or uneconomical or time consuming to study the entire population, a finite subset of the population known as sample is studied.
Size of the sample is denoted by n. Sampling is the process of drawing samples from a given population.
Large sampling
If n ≥ 30, the sampling is said to be large sampling
Small sampling
If n < 30, the sampling is said to be small sampling or exact sampling
Parameters
Statistical measures or constants obtained from the population are known as population parameters or simply parameters.
Example: Population mean, population variance. Similarly, statistical quantities computed from sample observations are known as sample statistics or briefly “statistics”. Thus parameters refer to population while statistics refer to sample.
Examples: sample mean, sample variance etc.
