Unit - 2
Boolean algebra
Q1) Explain De Morgan’s Theorem.
A1)
The equivalency of the NAND and NOR gates may be determined using De Morgan's Theorem and Laws.
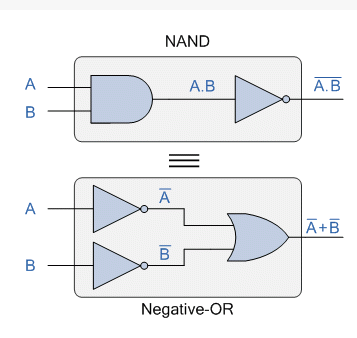
As we've seen, Boolean Algebra employs a collection of laws and rules to define the operation of a digital logic circuit, with "0's" and "1's" representing digital input and output conditions, respectively. These zeros and ones are used in Boolean Algebra to generate truth tables and mathematical formulas that explain the digital operation of logic AND, OR, and NOT (or inversion), as well as other logical operations like the XOR (Exclusive-OR) function.
While George Boole's set of laws and rules enable us to analyse and simplify a digital circuit, two of them are attributed to Augustus DeMorgan (a nineteenth-century English mathematician) and treat the logical NAND and NOR operations as separate NOT AND and NOT OR functions.
But, before we go into DeMorgan's Theory, let's review the fundamental logical operations. A and B are logic (or Boolean) input binary variables whose values can either be "0" or "1," resulting in four potential input combinations: 00, 01, 10, and 11.
Truth Table for Each Logical Operation
Input Variable | Output Conditions | ||||||
A | B | AND | NAND | OR | NOR |
|
|
0 | 0 | 0 | 1 | 0 | 1 |
|
|
0 | 1 | 0 | 1 | 1 | 0 |
|
|
1 | 0 | 0 | 1 | 1 | 0 |
|
|
1 | 1 | 1 | 0 | 1 | 0 |
|
|
The following table lists typical logic functions and their Boolean equivalents, where a “.” (dot) indicates an AND (product) operation, a “+” (plus sign) indicates an OR (sum) action, and a bar over a variable indicates the complement or inverse of the variable.
Logic Function | Boolean Notation |
AND | A.B |
OR | A+B |
NOT | A |
NAND | A .B |
NOR | A+B |
Q2) Explain De Morgan’s Theory.
A2)
DeMorgan's Theorems are two sets of rules or laws derived from Boolean expressions for AND, OR, and NOT with two input variables A and B. The input variables can be negated and transferred from one form of a Boolean function to the other form using these two principles or theorems.
The first theorem of DeMorgan states that two (or more) variables NORed together are equivalent to two variables inverted (Complement) and ANDed, whereas the second theorem claims that two (or more) variables NANDed together are equivalent to two terms inverted (Complement) and ORed. That is, all OR operators should be replaced with AND operators, and all AND operators should be replaced with OR operators.
1. DeMorgan’s First Theorem
DeMorgan's First Theorem states that the OR of the complements of two (or more) input variables is equivalent to the OR of the complements of the individual variables. As a result, the negative-OR function will be the equivalent of the NAND function, proving that A.B = A+B. The following table can be used to demonstrate this process.
Verifying DeMorgan’s First Theorem using Truth Table
Inputs | Truth Table Outputs For Each Term | ||||||
B | A | A.B | A.B | A | B | A + B |
|
0 | 0 | 0 | 1 | 1 | 1 | 1 |
|
0 | 1 | 0 | 1 | 0 | 1 | 1 |
|
1 | 0 | 0 | 1 | 1 | 0 | 1 |
|
1 | 1 | 1 | 0 | 0 | 0 | 0 |
|
We can also show that A.B = A+B using logic gates as shown.
DeMorgan’s First Law Implementation using Logic Gates
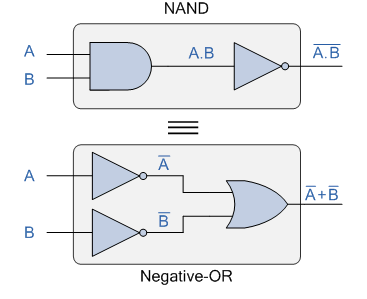
A normal NAND gate with inputs A and B can be used to build the top logic gate layout of: A.B. The two inputs are first inverted by the lower logic gate arrangement, resulting in A and B. These are then used as the OR gate's inputs. As a result, the OR gate's output becomes: A+B.
Then we can see that a NAND gate function is similar to a regular OR gate function with inverters (NOT gates) on each of its inputs. The equivalent of a NAND gate is a negative-OR, therefore an individual NAND gate may be expressed in this fashion.
2. DeMorgan’s Second Theorem
DeMorgan's Second Theorem states that the AND of the complements of two (or more) input variables is equivalent to the AND of the complements of the individual variables. As a result, the negative-AND function is the equivalent of the NOR function, establishing that A+B = A.B, which we can demonstrate using the truth table below.
Verifying DeMorgan’s Second Theorem using Truth Table
Inputs | Truth Table Outputs For Each Term | ||||||
B | A | A+B | A+B | A | B | A . B |
|
0 | 0 | 0 | 1 | 1 | 1 | 1 |
|
0 | 1 | 1 | 0 | 0 | 1 | 0 |
|
1 | 0 | 1 | 0 | 1 | 0 | 0 |
|
1 | 1 | 1 | 0 | 0 | 0 | 0 |
|
We can also show that A+B = A.B using the following logic gates example.
DeMorgan’s Second Law Implementation using Logic Gates
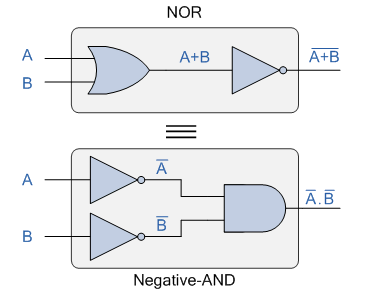
With inputs A and B, the top logic gate arrangement of: A+B can be accomplished using a normal NOR gate function. The two inputs are first inverted by the lower logic gate arrangement, resulting in A and B. As a result, the AND gate's inputs are formed. As a result, the AND gate's output becomes: A.B.
Then we can see that a conventional AND gate function with inverters (NOT gates) on each of its inputs generates an equivalent output state to a typical NOR gate function, and thus an individual NOR gate can be represented in this way as a negative-AND equivalency.
Although we have only utilised DeMorgan's theorems with two input variables A and B, they are equally true when applied to expressions with three, four, or more input variables, such as:
For a 3-variable input
A.B.C = A+B+C
And also
A+B+C = A.B.C
For a 4-variable input
A.B.C.D = A+B+C+D
And also
A+B+C+D = A.B.C.D
And so on.
Q3) Explain DeMorgan’s Equivalent Gates.
A3)
We've shown that using DeMorgan's Theorems, we can replace all of the AND (.) operators with an OR (+) and vice versa, and then complement each of the terms or variables in the expression by inverting it, converting 0s to 1s and 1s to 0s before inverting the entire function.
To make a DeMorgan equivalent of an AND, NAND, OR, or NOR gate, just add inverters (NOT-gates) to all inputs and outputs, and change an AND symbol to an OR symbol or an OR symbol to an AND symbol, as indicated in the table below.
DeMorgan’s Equivalent Gates
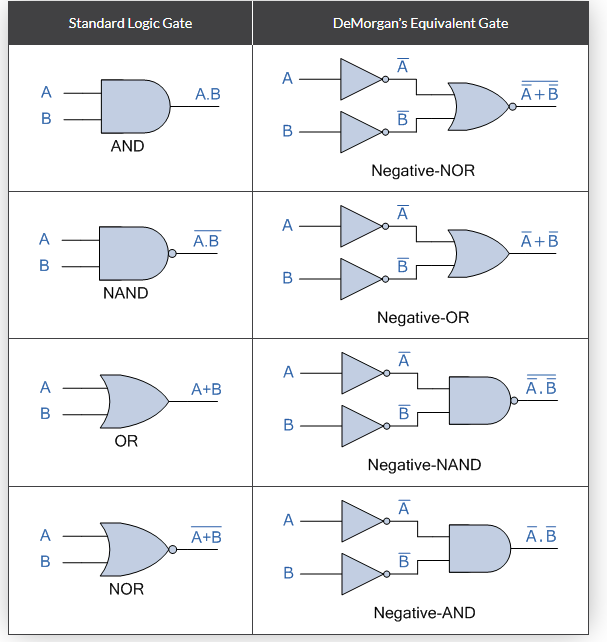
The complement of two (or more) AND'ed input variables is equivalent to the OR of the complements of these variables, and the complement of two (or more) OR'ed variables is equivalent to the AND of the complements of the variables as defined by DeMorgan, as we saw in this tutorial about DeMorgan's Thereom.
Q4) Explain Boolean algebra laws.
A4)
Boolean algebra is a field of mathematics in which the variables' values are either true or false, symbolised by 1 and 0 accordingly. In elementary algebra, the variables' values are represented by numbers, and the basic operations are addition and multiplication. Let's have a look at the laws of Boolean algebra in a more straightforward manner.
Boolean algebra laws are divided into six categories. They are as follows:
- Commutative law, associative law, and distributive law are all terms used to describe how laws work.
- AND THE LAW
- OR the law
- The law of inversion
Commutative Law
A commutative operation is defined as any binary operation that meets the following expression. The commutative law states that changing the order of the variables has no influence on the logic circuit's output.
- B = B. A
- A + B = B + A
Associative Law
It states that the order in which the logic operations are performed is irrelevant as their effect is the same.
- ( A. B ). C = A . ( B . C )
- ( A + B ) + C = A + ( B + C)
Distributive Law
The following conditions are stated in distributive law:
- ( B + C) = (A. B) + (A. C)
- A + (B. C) = (A + B) . ( A + C)
AND Law
The AND operation is used in these laws. As a result, they're known as AND laws.
- A .0 = 0
- A . 1 = A
- A = A
- A.A¯=0
OR Law
The OR operation is used in these laws. As a result, they are known as OR laws.
- A + 0 = A
- A + 1 = 1
- A + A = A
- A+A¯=1
Inversion Law
The NOT operation is used in this law. According to the inversion law, double inversion of a variable results in the original variable.
A+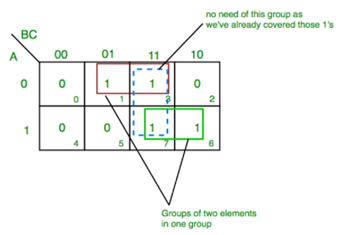 =1
=1
Q5) Explain Karnaugh of K-map.
A4)
Introduction of K-Map (Karnaugh Map)
We need to find expressions with the fewest variables in various digital circuits and practical situations. Without employing any Boolean algebra theorems, we can simply minimise Boolean expressions of 3, 4 variables using K-map. According on the needs of the situation, K-map can take two forms: Sum of Product (SOP) and Product of Sum (POS). The K-map is a table-like representation that provides more data than the TRUTH TABLE. We start by filling the grid of the K-map with 0s and 1s, then we solve it by forming groups.
Steps to solve expression using K-map-
1. Choose a K-map based on the amount of variables.
2. Determine the problem's minterms and maxterms.
3. For SOP, place 1s in K-map blocks that correspond to the minterms (0s elsewhere).
4. For POS, place 0s in K-map blocks that correspond to the maxterms(1s elsewhere).
5. Create rectangular groups with total terms in powers of two, such as 2,4,8,...(except 1), and try to include as many items as possible in each group
6. Find the product words from the groups created in step 5 and add them up for the SOP form.
SOP FORM
K-map of 3 variables-
Z= ∑A,B,C(1,3,6,7)
We receive the product term A'C from the red group.
We acquire the product term AB from the green group.
We derive the final phrase (A'C+AB) by adding these product terms together.
K-map for 4 variables
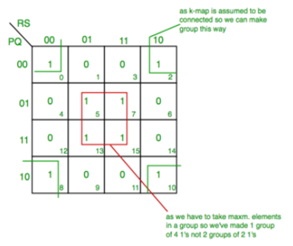
F(P,Q,R,S)=∑(0,2,5,7,8,10,13,15)
From red group we get product term— QS
From green group we get product term— Q’S’
Summing these product terms we get- Final expression (QS+Q’S’)
POS FORM
K-map of 3 variables-
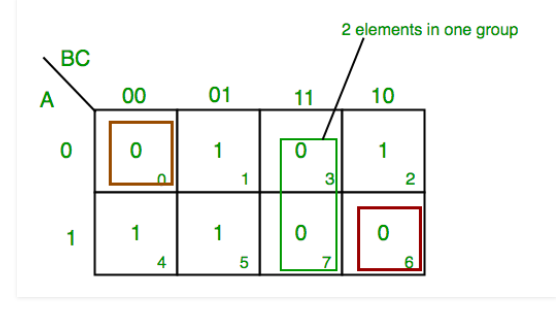
F(A,B,C)=π(0,3,6,7)
From red group we find terms
A B C’
Taking complement of these two
A’ B’ C
Now sum up them
(A’ + B’ + C)
From green group we find terms
B C
Taking complement of these two terms
B’ C’
Now sum up them
(B’+C’)
From brown group we find terms
A’ B’ C’
Taking complement of these two
A B C
Now sum up them
(A + B + C)
We will take product of these three terms: Final expression (A’ + B’ + C) (B’ + C’) (A + B + C)
K-map of 4 variables-
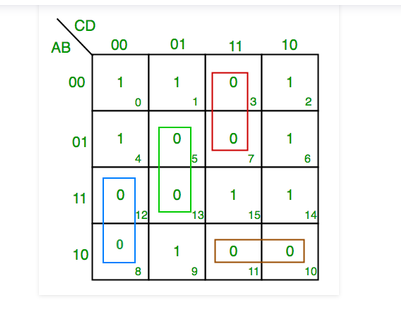
F(A,B,C,D)=π(3,5,7,8,10,11,12,13)
From green group we find terms
C’ D B
Taking their complement and summing them
(C+D’+B’)
From red group we find terms
C D A’
Taking their complement and summing them
(C’+D’+A)
From blue group we find terms
A C’ D’
Taking their complement and summing them
(A’+C+D)
From brown group we find terms
A B’ C
Taking their complement and summing them
(A’+B+C’)
Finally we express these as product –(C+D’+B’).(C’+D’+A).(A’+C+D).(A’+B+C’)
PITFALL– *Always remember POS ≠ (SOP)’
*The correct form is (POS of F)=(SOP of F’)
Q6) Give the Use of Karnaugh Map.
A5)
Let's put the Karnaugh map to work now that we've created it using Venn diagrams. When compared to Boolean algebra, Karnaugh maps reduce logic functions more rapidly and readily. We use the term "reduce" to signify "simplify," as in "lower the number of gates and inputs."
We prefer to reduce logic to its simplest form in order to save money by eliminating components. The smallest number of gates with the smallest number of inputs per gate is defined as the lowest cost.
When given the option, most students prefer to use Karnaugh maps instead of Boolean algebra to simplify logic.
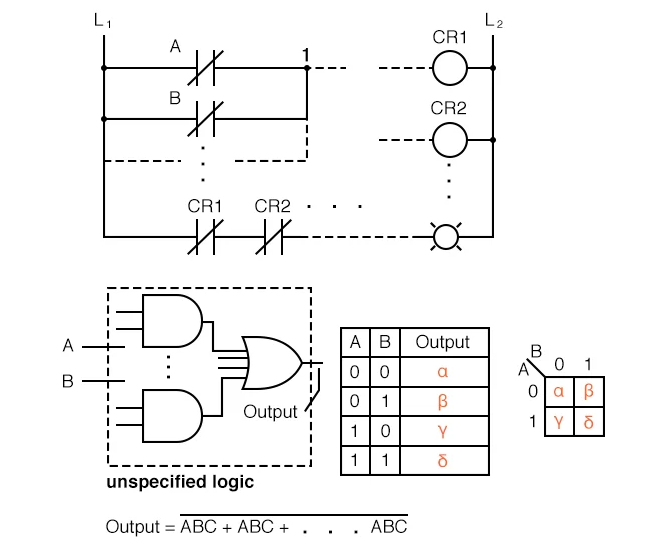
Above, we have five separate items that are simply alternative ways of describing the same thing: an arbitrary 2-input digital logic function. Relay ladder logic is the first step, followed by logic gates, a truth table, a Karnaugh map, and a Boolean equation.
The key is that any of these can be used in the same way. As the case may be, two inputs A and B can take on values of 0 or 1, high or low, open or closed, True or False. There are 22 = 4 input combinations that result in an output. This holds true for all five situations.
These four outputs can be seen on a relay ladder logic lamp, as well as a logic probe on a gate diagram. The truth table or the Karnaugh map can be used to keep track of these results. Consider the Karnaugh map to be a reshuffled truth table.
The truth table or Karnaugh map can be used to compute the output of the Boolean equation using the laws of Boolean algebra.
Should we utilise one of the five equivalent logic descriptions? The one that is most beneficial to the work at hand.
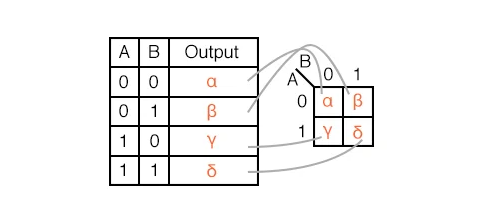
A truth table's outputs are identical to Karnaugh map entries on a one-to-one basis. The A=0, B=0 inputs produce an output starting at the top of the truth table.
Note that the A=0, B=0 cell address in the Karnaugh map, where the A=0 row and B=0 column intersect, produces the same output. Other truth table outputs from inputs AB=01, 10, 11 can be found at corresponding K-map positions.
With the use of a prior rectangular Venn diagram resembling Boolean regions, we display the adjacent 2-cell regions in the 2-variable K-map below.
Q7) Give advantages and disadvantages of K - Map.
A6)
Advantages of K-Maps
1. When compared to the method of solving logical expressions using Boolean principles, the K-map simplification methodology is easier and less error-prone.
2. It eliminates the need to memorise all of the Boolean algebraic theorems.
3. It requires fewer steps to arrive at a simpler expression than the algebraic minimization methodology.
4. When used correctly, the K-map simplification technique always yields the smallest expression.
Disadvantages of K-Maps
1. The K-map simplification method becomes more difficult as the number of variables in the logical statement grows.
2. Depending on the choices taken while building the groups, the smallest logical expression obtained via the K-map simplification process may or may not be unique. For example, we can get two alternative but accurate logical expressions for the output variable Y given by the K-map in Figure 10. The third term, which might be either BC or AC, shows the variation in the answer produced (highlighted in Figure 10). This change is dependent on whether the cells (0,4) or (4,6) are grouped together to form a two-celled group to cover the one seen in the K-map cell numbered 4.
Q8) Explain CRO and its Block Diagram.
A7)
The cathode ray oscilloscope, often known as a CRO, is an electronic instrument that displays a signal waveform visually.
It is the most versatile and helpful equipment in the electrical industry.
CRO is commonly used in radio and television receiver troubleshooting, as well as laboratory research and design.
The wave patterns of alternating currents and voltages can be examined using a CRO. Voltage, current, power, frequency, and phase shift can all be measured with it. Oscilloscopes come in a variety of shapes and sizes, and they can be used for a variety of tasks.
Block Diagram of CRO (Cathode Ray Oscilloscope)
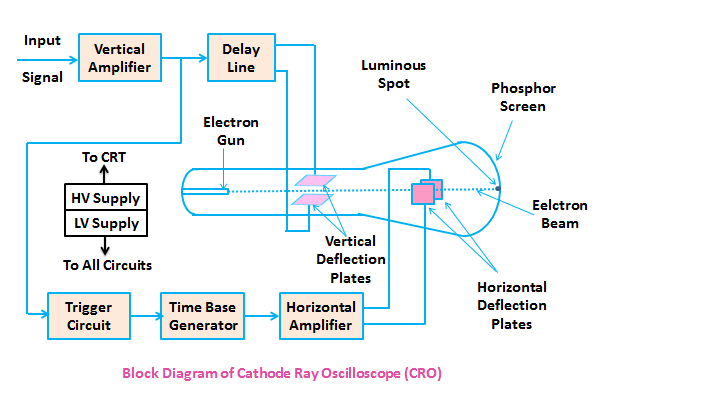
The figure below shows the block diagram of a general purpose CRO.
A CRO uses a cathode ray tube (CRT), which serves as the oscilloscope's heart, as seen in the diagram above.
The electron beam is accelerated to a high velocity and brought into focus on a fluorescent screen by the CRT in an oscilloscope. When the electron beam reaches this screen, it creates a visible spot. The electrons may be made to function as an electrical pencil of light by deflecting the beam over the screen in response to an electrical signal, producing a spot of light wherever it strikes.
Various electrical signals and voltages are required to complete these duties, which are given by the oscilloscope's power supply circuit.
The heater of the electron cannon, which generates the electron beam, requires a low voltage source, whereas the cathode ray tube, which accelerates the beam, requires a high voltage supply. The oscilloscope's other control modules require a standard voltage source.
Between the electron gun and the screen are horizontal and vertical deflection plates that deflect the beam according to the input signal.
A time base generator is included in the oscilloscope to deflect the electron beam on the screen in the horizontal direction (X-axis) at a constant time dependent rate.
The signal to be examined is sent into the vertical deflection plate through the vertical amplifier, which amplifies the signal to a level that allows the electron beam to be deflected.
Because the electron beam is deflected in both the X and Y axes, a triggering circuit is included to synchronise the two types of deflections so that horizontal deflection begins at the same place on the input vertical signal every time it sweeps.
We'll go through the many components of the CRT in detail because it's the heart of the oscilloscope.
Q9) Explain Cathode Ray Tube.
A8)
The cathode ray tube, often known as the CRT, is a vacuum tube with a unique geometrical shape that converts an electrical signal into a visual signal.
A CRT makes a vast number of electrons available, which are accelerated to high speeds and focused on a fluorescent screen, where they generate a spot when they strike it. In reaction to the provided electrical signal, the electron beam is deflected during its trip. As a result, the waveform of the electrical signal is seen.
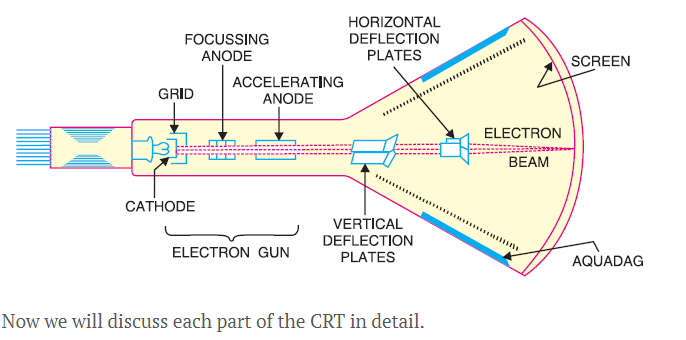
The parts of a cathode ray tube (CRT) are shown in the diagram below.
(i) Glass Envelope
It is a conical highly evacuated glass enclosure which maintains vacuum inside it and supports numerous electrodes.
The inside wall of a CRT between the neck and the screen is commonly coated with aquadag, a conductive material. This coating is electrically coupled to the accelerating anode, allowing electrons to be returned to the anode if they mistakenly strike the walls. This keeps the walls from reaching a dangerously low negative potential.
(ii) Electron Gun Assembly
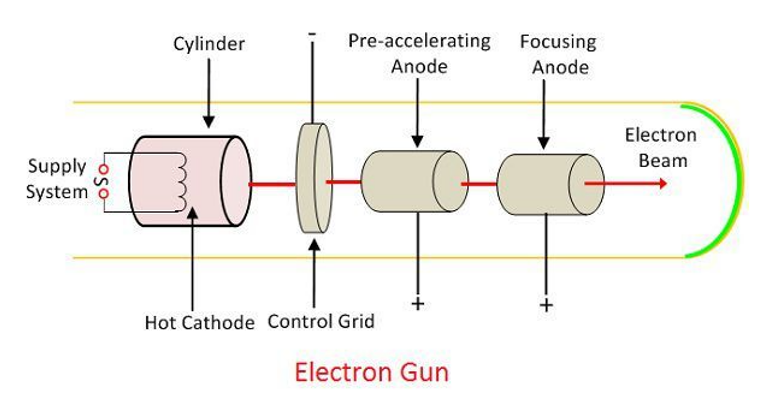
The electron gun assembly produces a focussed beam of electrons by combining an indirectly heated cathode, a control grid, a focussing anode, and an accelerating anode.
In relation to the cathode, the control grid is held at a negative potential. The two anodes, on the other hand, are kept at a high positive potential in relation to the cathode.
The cathode is made out of a nickel cylinder with an oxide layer that provides a lot of electrons.
To keep the electron beam modest, the control grid encloses the cathode and is made up of a metal cylinder with a tiny circular opening.
The focusing anode concentrates the electron beam into a precise pin point by regulating the positive voltage on it.
The electron beam is accelerated to a high velocity due to the positive potential of around 10,000 V on the accelerating anode, which is significantly larger than on the focusing diode.
When the electron gun assembly impacts the screen, it produces a narrow, accelerated electron beam that produces a pinpoint of light.
(iii) Deflection Plate Assembly
It is used to deflect the beam and comprises of two sets of deflecting plates within the tube beyond the accelerating anode.
The vertical deflection plates are one set, and the horizontal deflection plates are the other.
In the tube, the vertical deflection plates are positioned horizontally. The electron beam can be made to move up and down vertically on the screen by applying suitable potential to these plates.
In the tube, the horizontal deflection plates are positioned vertically. The electron beam can be made to go right and left horizontally on the screen by applying the necessary potential to these plates.
(iv) Screen
The screen is the interior face of the tube and is coated with fluorescent materials such as zinc orthosilicate, zinc oxide, and others.
When a high-velocity electron beam collides with the screen, a bright spot appears at the collision location. The colour of the spot is determined by the fluorescent substance used.
Q10) Explain Electron gun.
A9)
Definition: The term "electron cannon" refers to a device that produces a focussed and accelerated electron beam. It is a gadget that displays images on the phosphorous screen of a Cathode Ray Tube. A heater, cathode, grid, pre-accelerating, accelerating, and focusing anode enable the electron cannon emit electrons and form them into a beam.
Emission of Electrons
The electrons are emitted through the cathode that is heated indirectly. The term "indirectly heated cathode" refers to a cathode electrode that is encircled by a filament that emits electrons when power is applied across it.
A layer of barium and strontium oxide is added to the cathode's end to achieve high electron emission at a moderate temperature. The indirectly heated cathode's current and voltage requirements are almost equal to 600 mA and 6.3V.
Working of Electron Gun
The electron goes via the control grid after departing the cathode. Nickel is used to make the control grid. It has a central hole and runs parallel to the CRT axis. The number of electrons emitted from the cathode determines the intensity of the control beams. Negative biassing controls the flow of electrons on the grid.
The high positive voltage applied across the pre-accelerating and accelerating grids accelerates the electron that passes from the control grid. The focusing anode concentrates the electron beam. The beam passes via the deflection plates and onto the fluorescent screen after passing through the focusing anode.
Construction of Electron Gun
The electron gun's primary function is to produce and accelerate an electron beam inside the CRT's vacuum tube. The heater, cathode electrodes, grid, and several types of anodes are needed to generate and accelerate the gun. Below is a detailed explanation of their components.
1. Heater – The electric energy is converted into heat by the heater. It has a resistor that prevents current from flowing and transforms it to heat energy. The heater emits electrons by heating the cathode electrodes.
2. Control Grid – A nickel cylinder serves as the control grid. It's a metallic cup made of steel with a decreased permeability. It is 15 mm in length and 15 mm in diameter. For electron flow, a hole of roughly 0.25 mm is drilled in the cap of the grid. The intensity of the electron beam travelling through the grid is determined by electron emission. Negative biassing controls the flow of electrons through the control grid.
3. Pre-Accelerating & Accelerating Anode – The beams travelling through the gun were accelerated by the pre-accelerating and accelerating anodes. The electrons are accelerated by connecting these anodes to a high voltage.
4. Focussing Anode – The electrons flow through the focusing beam after passing through the pre-accelerating and accelerating electrodes. The focusing anode generates electron beams that are sharply focused.
The electron cannon is housed inside the glass tube to prevent the electron beam from colliding with the air molecules.
Q11) What is Time Base Generator?
A10)
A Time Base Generator is an electronic function generator that generates variable voltage or current to produce various time base signals. The electron beam is deflected horizontally in a Cathode-ray tube using the linear time-varying voltages created. This is commonly used to generate sawtooth waveforms in oscilloscopes.
The voltage should have a constant horizontal velocity to produce a sawtooth waveform. Ramp voltage is the name given to such a voltage. The Sawtooth waveform is generated when this voltage rapidly approaches zero. The sweep time Ts is the time it takes for the voltage to rise linearly, and the retrace time Tr is the time it takes for the wave to return to its start state in the sawtooth waveform. The waveform moves from left to right across the CRT screen. The deflection plates are equipped with a horizontal deflection Time-Base Generator for this purpose.
Circuit Diagram
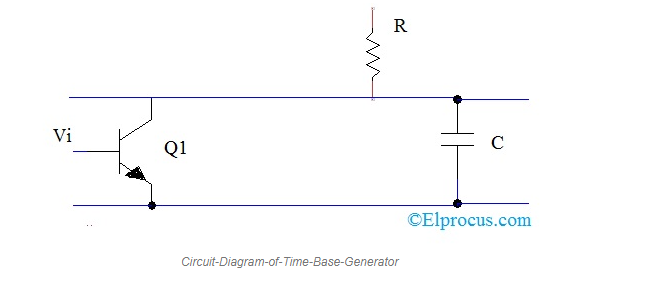
A variable resistor -R charges the capacitor-C and discharges it regularly through a transistor Q1 in the Time-Base Generator circuit. The sweep rate should be greater than the retrace time when creating sawtooth waveforms. The resistor in the circuit controls the waveform's sweep time.
Working Principle of Time-Base Generator
Across resistor R, the voltage Vcc is applied. The capacitor C begins to charge. The transistor Q1 is turned on by the input signal Vi. The capacitor is discharged through this transistor, which has a low resistance. The capacitor will charge exponentially to the supply voltage Vcc if the transistor is not turned on. The sawtooth waveform is created by the capacitor's controlled charging and discharging.
CRO use a Time-Base Generator to generate sawtooth waveforms. Sweep Generators are another name for these. An electron cannon produces an electron beam, which is displayed on a phosphorous-covered screen, and deflection plates deflect the beam. A Time-base generator is used with a CRT in radar systems to sweep the target position over the display and determine the target location. The Time-Base Generator is used in the early warning radar system. When the broadcasting signal is turned off, the sweep is started. When an echo is detected, the beam is diverted.
There are two Time-base generators in analogue television sets. One deflects the beam horizontally, while the other pulls it down the screen. To display diverse Time-base signals, the oscilloscope employs several time-base generators. What sorts of time-base generators are there?
Q12) Explain Electrostatic Deflection in CRT.
A11)
Definition: The process of aligning the route of charged particles by applying an electric field between the deflecting plates is known as electrostatic deflection. The term electrostatic refers to how the field's strength and direction change over time. As a result, the particles can only go in one direction. Deflecting plates are used in the cathode ray tube to change the path of electrons. After departing the electron gun, the electrons pass via deflecting plates. The electron beam is focused in the CRT using vertical and horizontal plates.
The horizontal deflection is caused by an electrical field created by the vertical plate in the horizontal plane. The other pair is horizontally positioned and induces vertical deflection by creating an electric field in the vertical plane. The beam can pass through these plates without colliding with the deflecting plates.
Electrostatic Deflection Arrangement
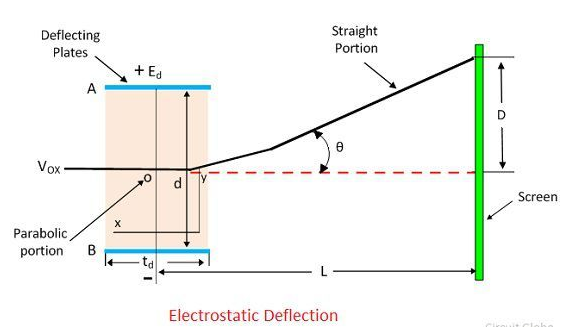
The electrostatic deflection is depicted in general in the diagram below. The potential difference is applied between A and B, which are two parallel plates. The consistent electrostatic field in the Y direction is created by these deflection plates.

When an electron passes through the gap between the plates, it feels a force only in one direction: Y. As a result, the electron will only go in that direction. In either the X or Z directions, there is no force. As a result, no electron acceleration occurs in that direction.
E0 is the pre-accelerating anode's voltage in volts.
e is the coulomb charge of an electron.
m is the mass of an electron in kilogrammes.
VOX is the electron's velocity in metres per second as it enters the deflecting plates.
In Volts, Ed represents the potential between deflecting plates.
In the metre, d is the distance between the deflecting plates.
Ld is the deflecting plate's length in metres.
L = Distance between the screen and the deflecting plates' midpoint.
D is the Y-direction deflection of the electron beam on the screen.
The electron loses potential energy as it passes from the accelerating cathode to the anode. The formula calculates the electron's potential energy.

The kinetic energy is gained by the electrons. And the equation gives them energy.
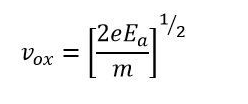
The velocity of the electron when it enters the deflecting plates is calculated by combining the potential and kinetic energy.

Because there was no force operating in the X direction, the electron's velocity in that direction remained constant throughout the deflection plate.

The electric field intensity in the Y direction is given by the equation.
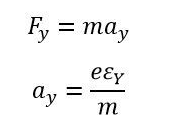
In the Y direction, the force acting on the electron. The term ay denotes electron acceleration in the y direction.

The electron's initial velocity as it enters the deflection plate is zero, and the equation gives the electron's displacement in the Y direction at any time t.
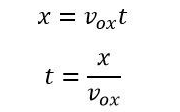
The Y-direction velocity is constant, and the Y-direction displacement is given as

In the displacement equation y, substituting the value of t yields

The parabola is represented by the equation above. At any point, the slope is expressed as

We get the value of tan by replacing x = ld.
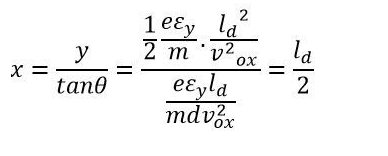
The electrons move into the straight line after passing through the deflection plate. This straight line intersects the X-axis at point O' and is tangent to the parabola at x = ld. The location of the point is determined by the equation.

The deflection D on the screen is expressed as

By substituting the value of v2ox in the above equation we get
We can deduce from the previous equation that the electron's deflection is proportional to the deflecting voltage.
Q13) Give Application of CRO.
A12)
Application of CRO
1. CRO has a wide range of applications in radio stations. True, those radio stations do not employ our standard CRO, but they are nearly identical to our standard CRO. CROs are used in radio stations to monitor the qualities of sending and receiving signals.
2. CRO aids in the observation of a signal's features and properties, which is why it aids in the control of analogue signals.
3. CRO can monitor the shape of the voltage and current waveforms, which aids in making the essential decisions in a radio station or communication station.
4. The CRO is utilised for research. When scientists construct a new circuit, they use a Cathode Ray Oscilloscope to check the voltage and current waveforms of each component.
5. CRO is used in conjunction with the resonance circuit to monitor bandwidth, wave form, and other parameters.
6. CRO was also used to examine the properties of Amplitude Modulation Circuits, Frequency Modulation Circuits, and other circuits.
Q14) Explain the Working Principle of Time – Base Generator.
A13)
Across resistor R, the voltage Vcc is applied. The capacitor C begins to charge. The transistor Q1 is turned on by the input signal Vi. The capacitor is discharged through this transistor, which has a low resistance. The capacitor will charge exponentially to the supply voltage Vcc if the transistor is not turned on. The sawtooth waveform is created by the capacitor's controlled charging and discharging.
CRO use a Time-Base Generator to generate sawtooth waveforms. Sweep Generators are another name for these. An electron cannon produces an electron beam, which is displayed on a phosphorous-covered screen, and deflection plates deflect the beam. A Time-base generator is used with a CRT in radar systems to sweep the target position over the display and determine the target location. The Time-Base Generator is used in the early warning radar system. When the broadcasting signal is turned off, the sweep is started. When an echo is detected, the beam is diverted.
There are two Time-base generators in analogue television sets. One deflects the beam horizontally, while the other pulls it down the screen. To display diverse Time-base signals, the oscilloscope employs several time-base generators. What sorts of time-base generators are there?
Q15) Deflection sensitivity.
A14)
A cathode ray tube's deflection sensitivity is the deflection on the screen caused by the beam in metres per volt of applied voltage.
This is not the same as CRO's deflection sensitivity. The gain of the amplifiers between the input terminals and the deflection plates is included in the CRO's deflection sensitivity.
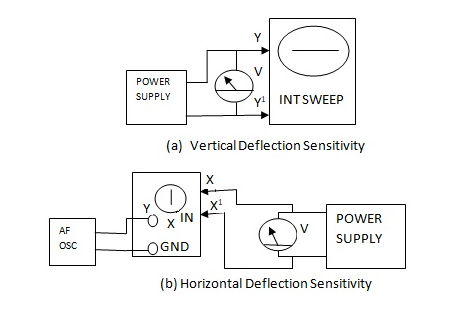
The deflection sensitivity of any CRO's cathode ray tube can be determined by directly applying a known voltage to the deflecting plates. Connection to the deflection plates can be accomplished using terminals on the CRO's frame that are accessible through a window-like opening from the protective covers.
Deflection Sensitivity of CRT
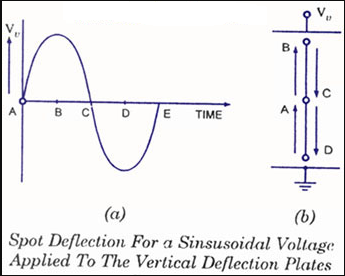
(a) Vertical deflection sensitivity:
The internal sweep can be employed to generate the horizontal line on the CRO to achieve vertical deflection sensitivity. The CRO must be set up for operation, and the horizontal line must be aligned with one of the graticule's horizontal lines. The voltage from a d.c power supply is placed between the vertical deflecting plates. To indicate the voltage delivered to the vertical deflecting plates, a multimeter with good sensitivity or a digital voltmeter is connected across the power supply. The horizontal line shifts up or down depending on the polarity of the applied voltage on the deflecting plates when the voltage is applied. The voltage is adjusted to produce a comfortable horizontal line displacement. The displacement in metres can now be determined by looking at the markings on the graticule. The deflection sensitivity can be computed and represented as meters/volt using this information.
(b) Horizontal deflection sensitivity:
Internal sweep is not required in this situation. It is possible to set the sweep mode switch to external mode. A low voltage alternating voltage will be used to power the vertical deflecting plates. A vertical line will appear on the screen. This line is parallel to one of the graticule's vertical lines. The horizontal deflecting plates get a d.c voltage from a power supply. A multimeter or similar device is used to measure the voltage applied. The vertical line will shift to the left or right depending on how much voltage is applied to the horizontal deflecting plates. The polarity of the applied voltage on the deflecting plates determines this. The voltage will be tweaked to get a comfortable deflection across the scale. It will be recorded what voltage is required for that displacement. The sensitivity to deflection can then be computed and given in m/V.
Q16) Give Measurement of Electrical Quantities with a CRO.
A15)
CRO is a very versatile instrument in laboratory for measurement of voltage, current, frequency and phase angle of any electrical quantity. But before we go ahead with discussion on measurement of electrical quantities with CRO, we should understand some basic oscilloscope patterns.
Basic Oscilloscope Patterns
Assume that the horizontal deflection plates receive a sinusoidal voltage signal while the vertical deflection plates receive no voltage signal, as shown in figure.
Because the voltage is zero at point A in time, the spot in the screen's centre remains undeflected. Voltage Vh is at its maximum positive at point B in time, hence the spot is at the far right end of the screen. At point C in time, the voltage is zero again, and the spot returns to the centre of the screen. The voltage is at its most negative at point D in time, hence the spot is at the far left edge of the screen. The voltage is zero at point E in time, hence the spot returns to the centre of the screen. As a result, the spot on the screen travels from point A to position B for the following voltage cycle. As a result, a horizontal line appears on the screen.
One thing to keep in mind is that because no voltage has been applied to the vertical defection plates, this horizontal line is in the centre vertically.
When a sinusoidal voltage signal is provided to the vertical deflection plates and no voltage signal is provided to the horizontal deflection plates, a vertical line appears on the CRO screen, as shown in figure. This line would be horizontally in the centre of the screen.
We've already seen what happens when a sinusoidal voltage signal is applied to horizontal or vertical deflection plates on their own. Now we'll look at what happens when sinusoidal voltage signals are applied to both horizontal and vertical defection plates at the same time.
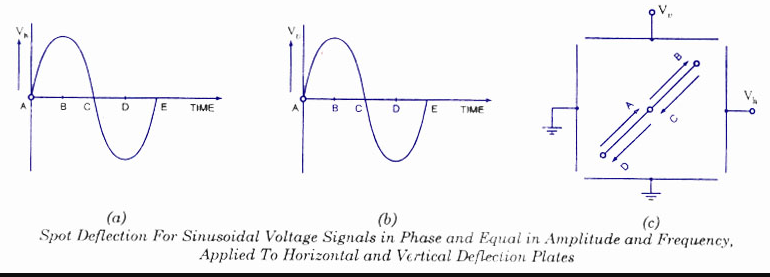
Consider the following scenario: two sinusoidal voltage signals of equal magnitude, frequency, and phase are applied to both the horizontal and vertical deflection plates, as illustrated in figure.
Voltages at both plates are zero at point A in time, hence the spot is in the middle of the screen. Because the voltages applied to both plates are maximum positive at point B in time, the spot appears at the extreme right end of the horizontal axis and extreme upward in the vertical axis. Both voltages are zero at point C in time, so the spot returns to the centre of the screen. The spot emerges at the extreme left end in the horizontal direction and extreme downward in the vertical direction at point D in time, when the voltages applied to both plates are maximum negative. Because both voltage signals are in phase and have the same amplitude and frequency, voltage signals applied to horizontal and vertical deflection plates have the same magnitude and sign at any given time. As a result, the spot moves in both horizontal (X-axis) and vertical (Y-axis) directions at any given time. As a result, a straight line with a 45° angle to the positive X-axis appears on the screen, as seen in figure.
It is critical to remember that the movement of the spot on the screen at any given time is the vector sum of the horizontal and vertical deflections, with the horizontal and vertical deflections being proportional to the voltages applied to the horizontal and vertical deflection plates, respectively. When sinusoidal voltage signals are given to horizontal and vertical deflection plates in phase and with identical amplitude and frequency, we get a straight line inclined at 45° to the positive X-axis, as previously indicated. When the amplitude of a sinusoidal voltage signal applied to vertical deflection plates is less than the amplitude of a voltage signal applied to horizontal deflection plates, the deflection is reduced.
The area of the spot along the Y-axis would be smaller than the area along the X-axis. As a result, we have a straight line that is inclined at an angle of less than 45 degrees to the positive X-axis. When the voltage applied to the vertical deflection plates is greater than the voltage supplied to the horizontal deflection plates, a straight line inclined at an angle more than 45 degrees to the positive X-axis results.
Consider the situation in which two sinusoidal voltage signals supplied to the horizontal and vertical deflection plates are of equal magnitude but phase opposite, as shown in figure.
Both voltage signals are 0 at time point A, therefore the spot is in the centre of the screen. The spot moves a maximum distance to the left and upward at point B in time, since the voltage applied to horizontal deflection plates is maximum negative and the voltage applied to vertical deflection plates is maximum positive, as illustrated in figure. Similarly, at point C in time, the spot returns to the screen's central position, and at point D, it moves to the maximum right and downward, as illustrated in the diagram. As a result, as illustrated in figure, we get a straight line inclined at 135° to the positive X-axis.
In the third scenario, a circle would appear on the screen if two sinusoidal voltage signals, 90° out of phase and of equal amplitude and frequency, were applied to the horizontal and vertical deflection plates. The voltage provided to the horizontal deflection plates is maximum positive at point A in time, while the voltage applied to the vertical deflection plates is zero, causing the spot to move to the extreme right end of the X-axis without moving along the Y-axis. The voltage applied to horizontal deflection plates is zero at point B in time, but the voltage applied to vertical deflection plates is maximum positive, therefore the spot moves maximally upward without moving horizontally. Similarly, the spot on the screen changes for points C and D in time, as indicated in figure. As a result, the spot traces a circle on the screen during one sine wave cycle.
Q17) Give Measurement of Voltage and Current.
A16)
Because the deflection of the electrostatic beam is precisely proportional to the deflection plate voltage, the Cathode Ray Oscilloscope can be used to monitor voltage of any electrical specification.
To measure direct voltage, the spot is initially centred on the screen without any voltage signal applied to the deflection plates. Then, between a pair of deflection plates, a direct voltage is supplied to be measured, and the deflection of the spot is observed on the screen. The direct voltage applied is equal to the size of the deflection multiplied by the deflection factor. The screen is usually calibrated for a specific working condition, so the CRO may measure voltage directly by reading the scale.
When measuring alternating voltage with a sinusoidal waveform, it is applied between two deflection plates and the straight line length is measured. The peak to peak value of applied ac voltage can be calculated using the deflection sensitivity. For a sinusoidal wave-form, the rms value of applied ac voltage is equal to the peak value divided by 22.
The current being measured is conducted via a known non-inductive resistance, and the voltage drop across it is measured by CRO, as previously indicated. The current can be calculated by simply dividing the voltage drop by the non-inductive resistance value. The voltage drop across non-inductive resistance (small value) is frequently increased by a calibrated amplifier when the current to be measured is of extremely tiny magnitude.
A twin beam cathode ray oscilloscope can measure both current and voltage at the same time.
Q18) Explain the principle of Mechanical Resonance.
A17)
The notion of mechanical resonance is used in one basic but rudimentary method of frequency measuring in power systems. Every physical object with the elasticity (springiness) quality has a natural frequency at which it prefers to vibrate.
A good example is a tuning fork: if you strike it once, it will continue to vibrate at a tone that is proportional to its length. Longer tuning forks have lower resonance frequencies, which means their tones will be lower on the musical scale.
Consider a row of tuning forks of varying sizes positioned side by side. They're all mounted on the same base, which is vibrated by an electromagnet at the frequency of the recorded AC voltage (or current).
The tuning fork with the closest resonance frequency to the vibration's frequency will shake the most (or the loudest). We could see the relative speed of each fork by the duration of the blur we saw as we studied each one from an end-view perspective if the tines were flimsy enough.
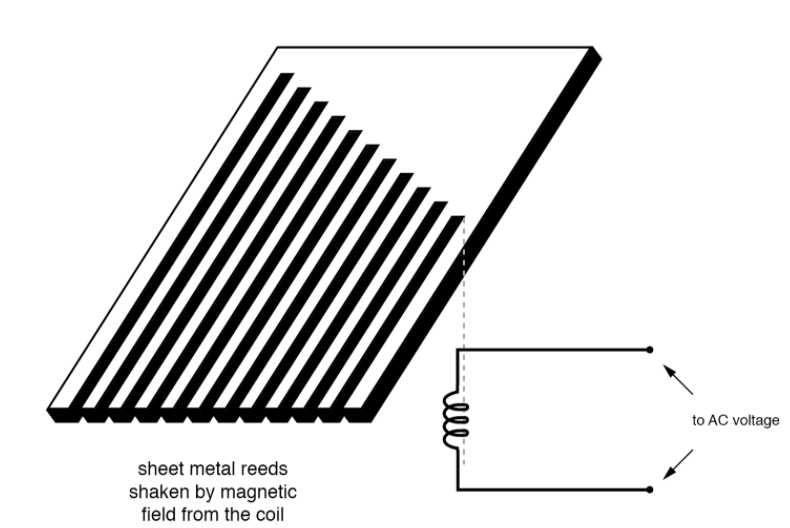
Make a set of "tuning forks" out of a strip of sheet metal cut in a rake-like pattern, and you've got yourself a vibrating reed frequency metre:
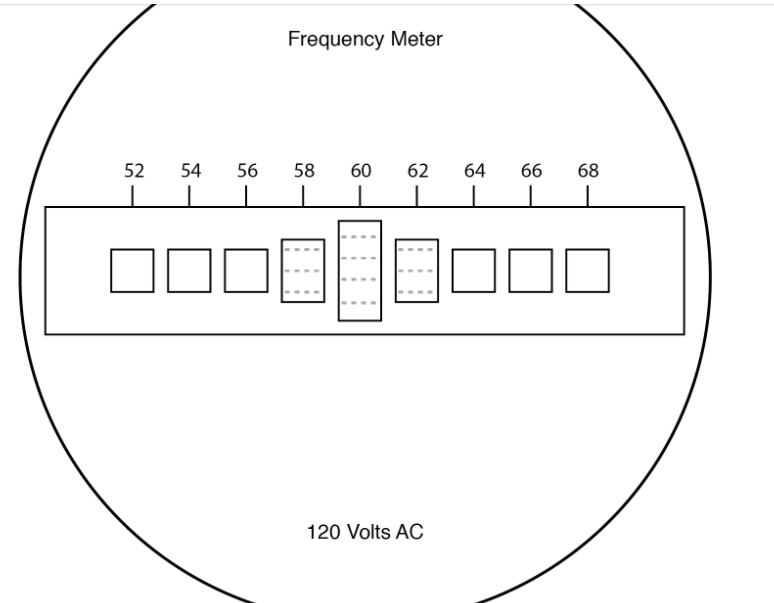
The user of this meter views the ends of all those unequal length reeds as they are collectively shaken at the frequency of the applied AC voltage to the coil. The one closest in resonant frequency to the applied AC will vibrate the most, looking something like:
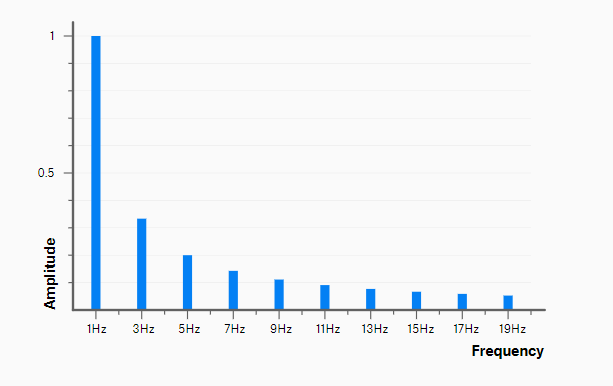
Fig. Vibrating reed frequency meter front panel.
Obviously, vibrating reed metres are not precision instruments, but they are basic and thus easy to construct in a tough manner. They're commonly seen on small engine-driven generator sets, where they're used to adjust the engine speed to keep the frequency near to 60 (50 in Europe).
Q19) Write a note on Reading Waveforms.
A18)
We're looking at a data visualisation in the form of a graph. The data we're graphing is a sound wave, which is represented by the blue line. It's specifically telling us about the displacement of the wave and how it evolves over time.
Let's take a closer look at what that entails.
Time
Time is represented by the horizontal line, our X axis.
Our graph shows a 1-second interval in this situation.
Displacement
The action of plucking a guitar string causes it to wobble back and forth. You could observe it sway from side to side like a clock's pendulum if you had a zoomed-in, slow-motion camera.
You could measure the distance the string moves from its default, resting position if you had the world's smallest ruler.
When a guitar string vibrates, it sets off a chain reaction with the air molecules around it, causing them all to vibrate and radiate outwards.
The displacement of air molecules is measured on our Y-axis. It's a metric for the loudness of a sound wave; a softly strummed guitar string vibrates only slightly, therefore the displacement would be negligible. If you pick the string, pull it back an inch, and then release it, the displacement of the string will be significantly higher, resulting in a considerably louder sound wave.
The waveform on the left depicts a single sound wave oscillation. It begins by displacing an air molecule in a positive direction by '1', then in a negative direction by '-1'.
Amplitude
Sound waves are represented as waveforms, which are abstract representations of them. We tend to employ abstract measurements when working with waveforms, even though a genuine sound wave might displace an air molecule by 4 nanometers.
This is where the concept of amplitude comes into play. It determines how far a molecule has moved from its resting state. In our example, we're going from 0 (quiet) to 1 (noise) (the maximum amount displaced).
Loudness can be equated to amplitude. The sound appears louder to us as the air molecules are moved more.
Let's make this a collaborative effort! To observe how changing the amplitude of the waveform impacts the graph, use the amplitude slider underneath the waveform.
Notice how the line flattens out when you set it all the way to 0. It's entirely silent if the amplitude is zero.
Frequency
The waveform has been changed to repeat twice in the allocated time (or, to put it another way, twice as quickly).
We're looking at a periodic waveform, which means it may be repeated to give a consistent tone. When you unmute the sound, you'll see that it's completely consistent from one second to the next. By repeating the waveform over and over, periodic waveforms allow you to create a steady sound. This is unlike, say, a piano, where the note quality changes with time.
The frequency of a waveform is the number of times it repeats in a given amount of time. The Hertz, abbreviated as "Hz," is a popular unit of frequency measurement that measures the number of repetitions per second.
We may determine that this wave is oscillating at 2Hz because the waveform graph displays a 1-second interval.
The terms "frequency" and "pitch" are interchangeable. The higher the pitch of a note, the faster a wave repeats itself.
A singer's throat vibrates at 440Hz when singing a "A4" note (the "A" in the centre of a standard piano). Their larynx would vibrate at 523Hz if they raised their voice to a "C5" note, 3 semitones higher.
This phenomena is not limited to music. Consider an automobile engine, and how the higher the pitch is the faster it "revs." The same can be true for a drill or a hand mixer. A discernible pitch should be present in any physical object that emits sounds hundreds or thousands of times per second.
However, not all sound is periodic. White noise, for example, is just a uniform distribution of audible frequencies, such as the sound of static or waves smashing on the shore. It has no discernible pitch because it isn't periodic.
With the frequency slider, play about with the frequency.
Q20) Write a note on The Square Waveform.
A19)
Among the common periodic waveforms, the square waveform is likely the most severe. It alternates between the greatest and lowest numbers conceivable. It's a binary wave with only two possibilities: +1 or -1.
The harmonics in the square waveform are identical to those in the triangle waveform: Each "abnormal" harmonic (3rd, 5th, 7th, etc). The distinction is that as you get further away from the root frequency, the square wave harmonics don't "fall off" as much. Consider how much louder square waves' higher-frequency harmonics are:
Q21) Write a note on The Triangle Waveform.
A20)
It has a similar appearance to the sine, but without the curviness. Instead, straight lines form triangle-like forms when they intersect.
What impact does this have on the sound quality? If you haven't already done so, press the M key to activate sound, then scroll between this and the previous section to hear the difference.
Have you noticed that the sound has become a little "brighter"? Isn't it a little less muted now? Harmonics are the reason behind this.
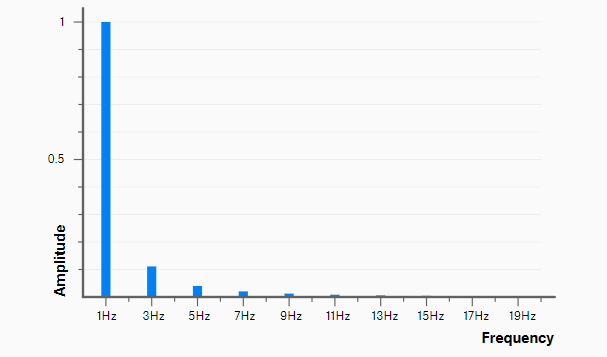
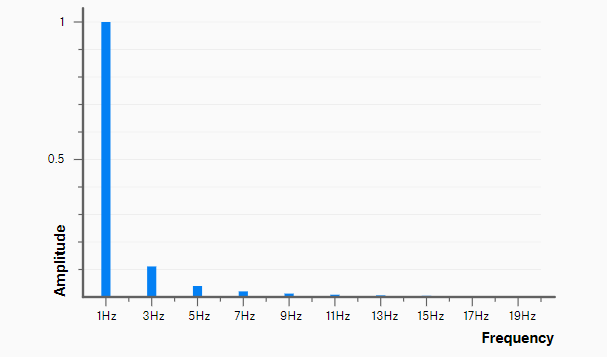
Certain waveforms produce harmonics, which are additional frequencies. Soon, we'll find why that is, but first, let's plot these additional harmonics:
Harmonics are always a multiple of the root frequency. Different waveforms have different selections, but they always follow the same pattern:
- Fundamental note (root frequency): 1Hz.
- Second harmonic (2x frequency): 2Hz.
- Third harmonic (3x frequency): 3Hz.
- Fourth harmonic (4x frequency): 4Hz.
- ... This pattern continues to infinity.
Triangle waves only have odd harmonics. That means they have the root note, 3rd harmonic, 5th harmonic, 7th harmonic, and so on. These harmonics "taper off" as you get further away from the root frequency.