 and defined as-
|

 is the probability of correct decision.Type-2 error-The decision relating to non-rejection of null hypo. When it is false is called type-1 error.It is denoted by
  and defined as-
|

Decision | |
|
Reject | Type-1 error | Correct decision |
Do not reject | Correct decision | Type-2 error |


|
|

|

 = 460,Sample size = 100Sample mean = 453Sample standard deviation = S = 25
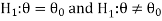
The null and alternative hypothesis will be-
Also the alternative hypothesis left-tailed so that the test is left tailed test. Here, we want to test the hypothesis regarding population mean when population SD is unknown. So we should used t-test for if writing-life of pen follows normal distribution. But it is not the case. Since sample size is n = 100 (n > 30) large so we go for Z-test. The test statistic of Z-test is given by
We get the critical value of left tailed Z test at 1% level of significance is Since calculated value of test statistic Z (= ‒2.8) is less than the critical value (= −2.33), that means calculated value of test statistic Z lies in rejection region so we reject the null hypothesis. Since the null hypothesis is the claim so we reject the manufacturer’s claim at 1% level of significance |


|

 > 1200 and its complement is
  ≤ 1200. Since complement contains the equality sign so we can take the complement as the null hypothesis and the claim as the alternative hypothesis. Thus,
|

|

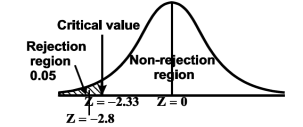
 1.645Since calculated value of test statistic Z (= 2.22) is greater than critical value (= 1.645), that means it lies in rejection region so we reject the null hypothesis and support the alternative hypothesis i.e. we support our claim at 5% level of significanceThus, we conclude that sample does not provide us sufficient evidence against the claim so we may assume that the company accepts the new brand of bulbs Q5) Eleven students were given a test in statistics. They were given a month’s further tuition and the second test of equal difficulty was held at the end of this. Do the marks give evidence that the students have benefitted by extra coaching?
Boys | 1 | 2 | 3 | 4 | 5 | 6 | 7 | 8 | 9 | 10 | 11 |
Marks I test | 23 | 20 | 19 | 21 | 18 | 20 | 18 | 17 | 23 | 16 | 19 |
Marks II test | 24 | 19 | 22 | 18 | 20 | 22 | 20 | 20 | 23 | 20 | 17 |
|

 Then
Then, | ||||||
Students |
|
|
|
|
| |
1 | 23 | 24 | 1 | 0 | 0 | |
2 | 20 | 19 | -1 | -2 | 4 | |
3 | 19 | 22 | 3 | 2 | 4 | |
4 | 21 | 18 | -3 | -4 | 16 | |
5 | 18 | 20 | 2 | 1 | 1 | |
6 | 20 | 22 | 2 | 1 | 1 | |
7 | 18 | 20 | 2 | 1 | 1 | |
8 | 17 | 20 | 3 | 2 | 4 | |
9 | 23 | 23 | - | -1 | 1 | |
10 | 16 | 20 | 4 | 3 | 9 | |
11 | 19 | 17 | -2 | -3 | 9 | |
|
|
|
|
|
| |


 (for v=10) =2.228. As the calculated value of
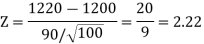
  , the value of t is not significant at 5% level of significance i.e. the test provides no evidence that the students have benefitted by extra coaching. Q6) From a random sample of 10 pigs fed on diet A, the increase in weight in certain period were 10,6,16,17,13,12,8,14,15,9 lbs. For another random sample of 12 pigs fed on diet B, the increase in the same period were 7,13,22,15,12,14,18,8,21,23,10,17 lbs. Test whether diets A and B differ significantly as regards their effect on increases in weight?A6) We calculate the means and standard derivations of the samples as follows
| Diet A |
|
| Diet B |
|
|
|
|
|
|
|
10 | -2 | 4 | 7 | -8 | 64 |
6 | -6 | 36 | 13 | -2 | 4 |
16 | 4 | 16 | 22 | 7 | 49 |
17 | 5 | 25 | 15 | 0 | 0 |
13 | 1 | 1 | 12 | -3 | 9 |
12 | 0 | 0 | 14 | -1 | 1 |
8 | -4 | 16 | 18 | 3 | 9 |
14 | 2 | 4 | 8 | -7 | 49 |
15 | 3 | 9 | 21 | 6 | 36 |
9 | -3 | 9 | 23 | 8 | 64 |
|
|
| 10 | -5 | 25 |
|
|
| 17 | 2 | 4 |
|
|
|
|
|
|
120 |
|
| 180 | 0 | 314 |


Assuming that the samples do not differ in weight so far as the two diets are concerned i.e.
For v=20, we find The calculated value of Hence the difference between the samples means is not significant i.e. thew two diets do not differ significantly as regards their effects on increase in weight. |


|
|

|
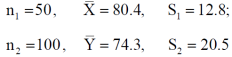
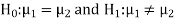
 denote the average marks of face to face and distance mode students respectively then our claim is
  and its complement is
  ≠
≠  . Since the claim contains the equality sign so we can take the claim as the null hypothesis and complement as the alternative hypothesis. Thus,
|
The critical (tabulated) values for two-tailed test at 5% level of significance are-
|


|

 ) of tube is 18000 km. So claim is μ = 18000 and its complement is μ ≠ 18000. Since the claim contains the equality sign so we can take the claim as the null hypothesis and complement as the alternative hypothesis. Thus,
|


|

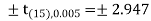 Since calculated value of test statistic t (= 1.33) is less than the critical (tabulated) value (= 2.947) and greater that critical value (= − 2.947), that means calculated value of test statistic lies in non-rejection region, so we do not reject the null hypothesis. we conclude that sample fails to provide sufficient evidence against the claim so we may assume that manufacturer’s claim is true. Q9) A set of five similar coins is tossed 320 times and the result is
Number of heads | 0 | 1 | 2 | 3 | 4 | 5 |
Frequency | 6 | 27 | 72 | 112 | 71 | 32 |
For v = 5, we have P, probability of getting a head=1/2;q, probability of getting a tail=1/2. Hence the theoretical frequencies of getting 0,1,2,3,4,5 heads are the successive terms of the binomial expansion
Thus the theoretical frequencies are 10, 50, 100, 100, 50, 10. Hence,
Since the calculated value of |


Round and yellow | Wrinkled and yellow | Round and green | Wrinkled and green | Total |
316 | 101 | 108 | 32 | 556 |
The corresponding frequencies are
Hence,
For v = 3, we have Since the calculated value of |


